Bahamian 3 or more Vehicles in Household
COMPARE
Bahamian
Select to Compare
3 or more Vehicles in Household
Bahamian 3 or more Vehicles in Household
16.9%
3+ VEHICLES AVAILABLE
0.1/ 100
METRIC RATING
293rd/ 347
METRIC RANK
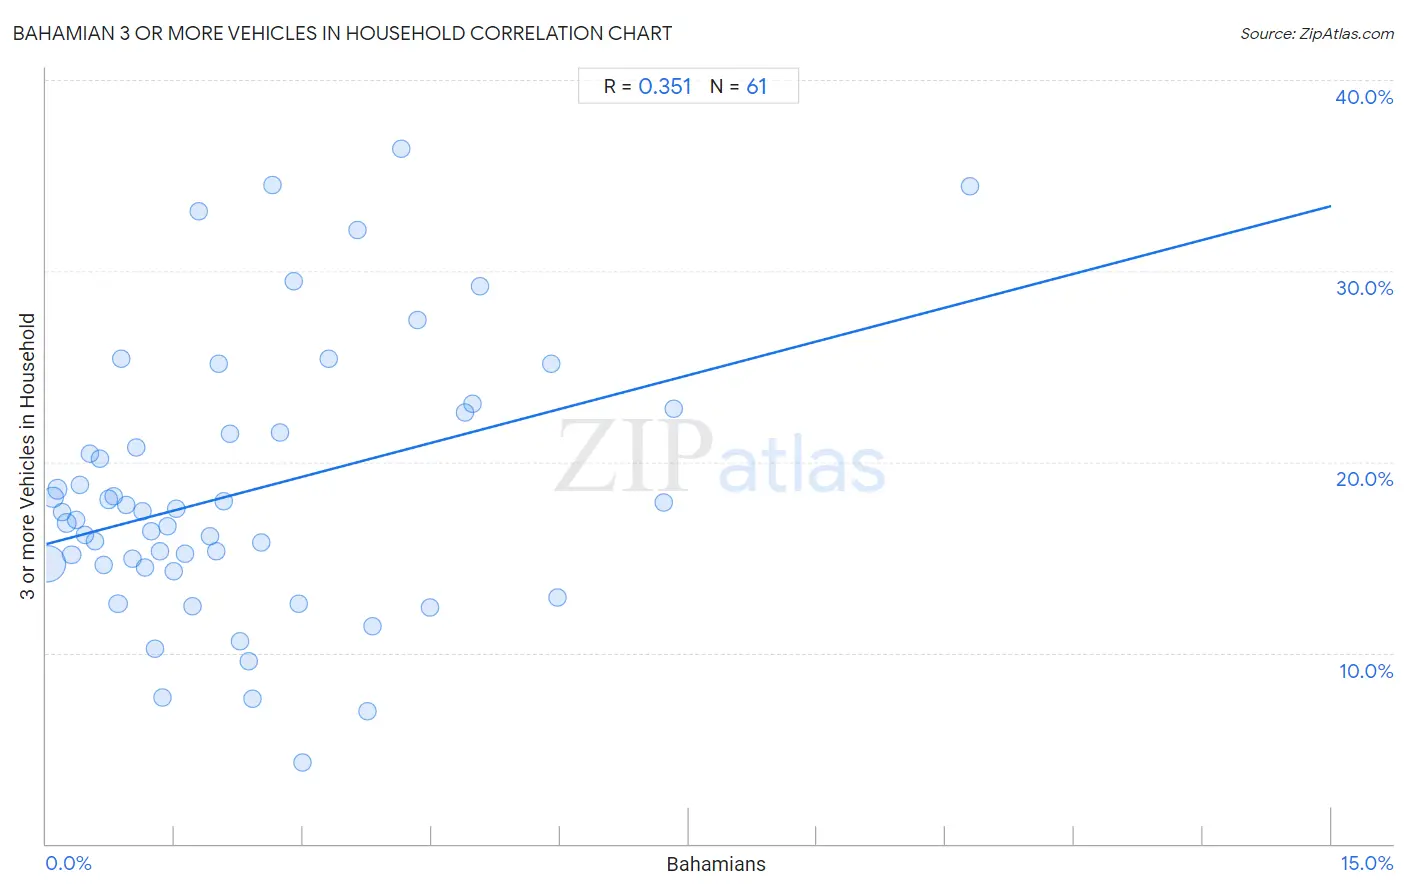
Bahamian 3 or more Vehicles in Household Correlation Chart
The statistical analysis conducted on geographies consisting of 112,623,128 people shows a mild positive correlation between the proportion of Bahamians and percentage of households with 3 or more vehicles available in the United States with a correlation coefficient (R) of 0.351 and weighted average of 16.9%. On average, for every 1% (one percent) increase in Bahamians within a typical geography, there is an increase of 1.2% in percentage of households with 3 or more vehicles available.
It is essential to understand that the correlation between the percentage of Bahamians and percentage of households with 3 or more vehicles available does not imply a direct cause-and-effect relationship. It remains uncertain whether the presence of Bahamians influences an upward or downward trend in the level of percentage of households with 3 or more vehicles available within an area, or if Bahamians simply ended up residing in those areas with higher or lower levels of percentage of households with 3 or more vehicles available due to other factors.
Demographics Similar to Bahamians by 3 or more Vehicles in Household
In terms of 3 or more vehicles in household, the demographic groups most similar to Bahamians are Immigrants from Spain (17.0%, a difference of 0.080%), Immigrants from Western Africa (16.9%, a difference of 0.11%), Immigrants from Russia (16.9%, a difference of 0.16%), Immigrants from Congo (17.0%, a difference of 0.20%), and Liberian (17.0%, a difference of 0.35%).
| Demographics | Rating | Rank | 3 or more Vehicles in Household |
| Menominee | 0.2 /100 | #286 | Tragic 17.2% |
| Immigrants from Brazil | 0.2 /100 | #287 | Tragic 17.1% |
| Immigrants from Uruguay | 0.2 /100 | #288 | Tragic 17.1% |
| Immigrants from Liberia | 0.1 /100 | #289 | Tragic 17.1% |
| Liberians | 0.1 /100 | #290 | Tragic 17.0% |
| Immigrants from Congo | 0.1 /100 | #291 | Tragic 17.0% |
| Immigrants from Spain | 0.1 /100 | #292 | Tragic 17.0% |
| Bahamians | 0.1 /100 | #293 | Tragic 16.9% |
| Immigrants from Western Africa | 0.1 /100 | #294 | Tragic 16.9% |
| Immigrants from Russia | 0.1 /100 | #295 | Tragic 16.9% |
| Inupiat | 0.1 /100 | #296 | Tragic 16.9% |
| Israelis | 0.1 /100 | #297 | Tragic 16.8% |
| Immigrants from Zaire | 0.1 /100 | #298 | Tragic 16.7% |
| Immigrants from South America | 0.1 /100 | #299 | Tragic 16.7% |
| Cypriots | 0.0 /100 | #300 | Tragic 16.6% |
Bahamian 3 or more Vehicles in Household Correlation Summary
| Measurement | Bahamian Data | 3 or more Vehicles in Household Data |
| Minimum | 0.017% | 4.2% |
| Maximum | 10.8% | 36.4% |
| Range | 10.8% | 32.2% |
| Mean | 2.3% | 18.4% |
| Median | 1.7% | 17.4% |
| Interquartile 25% (IQ1) | 0.81% | 14.5% |
| Interquartile 75% (IQ3) | 3.1% | 22.1% |
| Interquartile Range (IQR) | 2.3% | 7.5% |
| Standard Deviation (Sample) | 2.1% | 7.1% |
| Standard Deviation (Population) | 2.1% | 7.0% |
Correlation Details
| Bahamian Percentile | Sample Size | 3 or more Vehicles in Household |
[ 0.0% - 0.5% ] 0.017% | 79,566,586 | 14.7% |
[ 0.0% - 0.5% ] 0.077% | 12,657,226 | 18.1% |
[ 0.0% - 0.5% ] 0.13% | 6,200,765 | 18.6% |
[ 0.0% - 0.5% ] 0.19% | 3,573,940 | 17.4% |
[ 0.0% - 0.5% ] 0.24% | 1,427,342 | 16.8% |
[ 0.0% - 0.5% ] 0.29% | 1,860,787 | 15.1% |
[ 0.0% - 0.5% ] 0.35% | 892,171 | 17.0% |
[ 0.0% - 0.5% ] 0.40% | 749,143 | 18.8% |
[ 0.0% - 0.5% ] 0.46% | 706,201 | 16.2% |
[ 0.5% - 1.0% ] 0.51% | 745,618 | 20.5% |
[ 0.5% - 1.0% ] 0.57% | 565,412 | 15.8% |
[ 0.5% - 1.0% ] 0.62% | 509,767 | 20.1% |
[ 0.5% - 1.0% ] 0.67% | 574,611 | 14.6% |
[ 0.5% - 1.0% ] 0.73% | 283,431 | 18.0% |
[ 0.5% - 1.0% ] 0.79% | 221,731 | 18.2% |
[ 0.5% - 1.0% ] 0.84% | 264,243 | 12.6% |
[ 0.5% - 1.0% ] 0.88% | 132,873 | 25.4% |
[ 0.5% - 1.0% ] 0.94% | 189,649 | 17.8% |
[ 0.5% - 1.0% ] 1.00% | 296,445 | 14.9% |
[ 1.0% - 1.5% ] 1.05% | 70,662 | 20.8% |
[ 1.0% - 1.5% ] 1.12% | 46,612 | 17.4% |
[ 1.0% - 1.5% ] 1.15% | 60,436 | 14.4% |
[ 1.0% - 1.5% ] 1.23% | 31,590 | 16.4% |
[ 1.0% - 1.5% ] 1.27% | 109,405 | 10.2% |
[ 1.0% - 1.5% ] 1.33% | 74,297 | 15.3% |
[ 1.0% - 1.5% ] 1.36% | 25,473 | 7.7% |
[ 1.0% - 1.5% ] 1.42% | 18,091 | 16.6% |
[ 1.0% - 1.5% ] 1.48% | 145,059 | 14.3% |
[ 1.5% - 2.0% ] 1.52% | 176,766 | 17.5% |
[ 1.5% - 2.0% ] 1.62% | 48,077 | 15.2% |
[ 1.5% - 2.0% ] 1.70% | 86,097 | 12.4% |
[ 1.5% - 2.0% ] 1.78% | 338 | 33.1% |
[ 1.5% - 2.0% ] 1.91% | 47,981 | 16.1% |
[ 1.5% - 2.0% ] 1.98% | 14,126 | 15.3% |
[ 2.0% - 2.5% ] 2.01% | 947 | 25.1% |
[ 2.0% - 2.5% ] 2.07% | 8,340 | 18.0% |
[ 2.0% - 2.5% ] 2.15% | 37,274 | 21.5% |
[ 2.0% - 2.5% ] 2.26% | 2,349 | 10.6% |
[ 2.0% - 2.5% ] 2.37% | 7,689 | 9.6% |
[ 2.0% - 2.5% ] 2.40% | 16,449 | 7.6% |
[ 2.5% - 3.0% ] 2.51% | 3,192 | 15.8% |
[ 2.5% - 3.0% ] 2.64% | 2,576 | 34.5% |
[ 2.5% - 3.0% ] 2.73% | 48,792 | 21.5% |
[ 2.5% - 3.0% ] 2.88% | 27,583 | 29.4% |
[ 2.5% - 3.0% ] 2.95% | 847 | 12.5% |
[ 2.5% - 3.0% ] 2.98% | 6,266 | 4.2% |
[ 3.0% - 3.5% ] 3.30% | 7,385 | 25.4% |
[ 3.5% - 4.0% ] 3.64% | 9,677 | 32.1% |
[ 3.5% - 4.0% ] 3.74% | 1,950 | 7.0% |
[ 3.5% - 4.0% ] 3.81% | 18,487 | 11.4% |
[ 4.0% - 4.5% ] 4.14% | 1,714 | 36.4% |
[ 4.0% - 4.5% ] 4.34% | 8,118 | 27.4% |
[ 4.0% - 4.5% ] 4.48% | 15,735 | 12.4% |
[ 4.5% - 5.0% ] 4.89% | 2,190 | 22.6% |
[ 4.5% - 5.0% ] 4.97% | 2,151 | 23.0% |
[ 5.0% - 5.5% ] 5.07% | 2,426 | 29.2% |
[ 5.5% - 6.0% ] 5.90% | 305 | 25.1% |
[ 5.5% - 6.0% ] 5.97% | 486 | 12.9% |
[ 7.0% - 7.5% ] 7.21% | 14,698 | 17.9% |
[ 7.0% - 7.5% ] 7.32% | 1,011 | 22.8% |
[ 10.5% - 11.0% ] 10.78% | 1,540 | 34.4% |