Bahamian GED/Equivalency
COMPARE
Bahamian
Select to Compare
GED/Equivalency
Bahamian GED/Equivalency
83.6%
GED/EQUIVALENCY
0.8/ 100
METRIC RATING
252nd/ 347
METRIC RANK
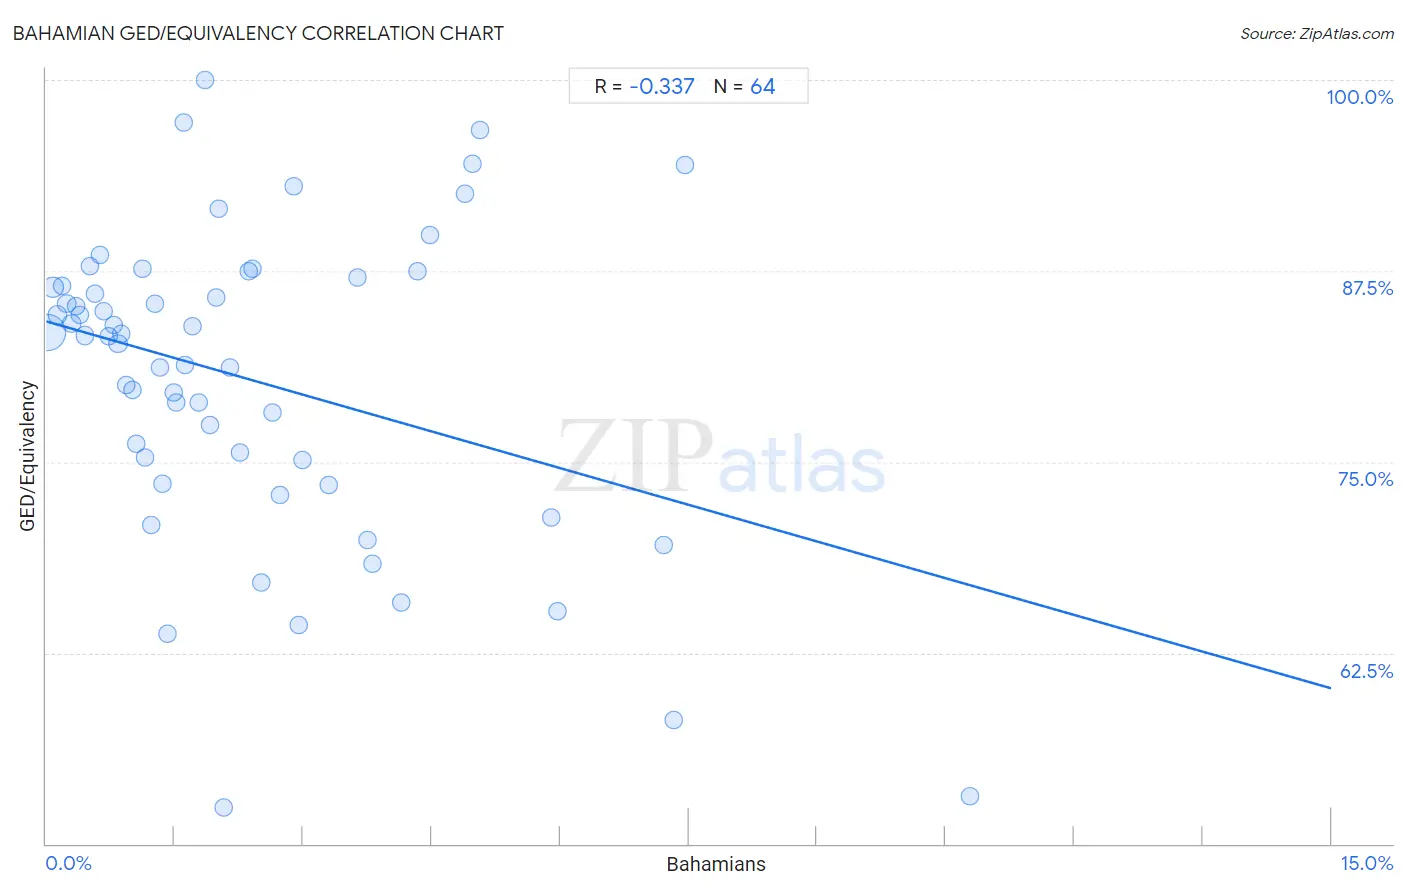
Bahamian GED/Equivalency Correlation Chart
The statistical analysis conducted on geographies consisting of 112,707,159 people shows a mild negative correlation between the proportion of Bahamians and percentage of population with at least ged/equivalency education in the United States with a correlation coefficient (R) of -0.337 and weighted average of 83.6%. On average, for every 1% (one percent) increase in Bahamians within a typical geography, there is a decrease of 1.6% in percentage of population with at least ged/equivalency education.
It is essential to understand that the correlation between the percentage of Bahamians and percentage of population with at least ged/equivalency education does not imply a direct cause-and-effect relationship. It remains uncertain whether the presence of Bahamians influences an upward or downward trend in the level of percentage of population with at least ged/equivalency education within an area, or if Bahamians simply ended up residing in those areas with higher or lower levels of percentage of population with at least ged/equivalency education due to other factors.
Demographics Similar to Bahamians by GED/Equivalency
In terms of ged/equivalency, the demographic groups most similar to Bahamians are Spanish American (83.6%, a difference of 0.0%), Comanche (83.6%, a difference of 0.060%), Creek (83.6%, a difference of 0.090%), Shoshone (83.7%, a difference of 0.15%), and Blackfeet (83.8%, a difference of 0.17%).
| Demographics | Rating | Rank | GED/Equivalency |
| Immigrants from Senegal | 1.2 /100 | #245 | Tragic 83.8% |
| Chickasaw | 1.2 /100 | #246 | Tragic 83.8% |
| Immigrants from Western Africa | 1.1 /100 | #247 | Tragic 83.8% |
| Blackfeet | 1.1 /100 | #248 | Tragic 83.8% |
| Crow | 1.1 /100 | #249 | Tragic 83.8% |
| Shoshone | 1.0 /100 | #250 | Tragic 83.7% |
| Spanish Americans | 0.8 /100 | #251 | Tragic 83.6% |
| Bahamians | 0.8 /100 | #252 | Tragic 83.6% |
| Comanche | 0.7 /100 | #253 | Tragic 83.6% |
| Creek | 0.7 /100 | #254 | Tragic 83.6% |
| Colville | 0.5 /100 | #255 | Tragic 83.4% |
| Africans | 0.5 /100 | #256 | Tragic 83.4% |
| Jamaicans | 0.4 /100 | #257 | Tragic 83.3% |
| Malaysians | 0.4 /100 | #258 | Tragic 83.3% |
| Immigrants from Vietnam | 0.3 /100 | #259 | Tragic 83.2% |
Bahamian GED/Equivalency Correlation Summary
| Measurement | Bahamian Data | GED/Equivalency Data |
| Minimum | 0.017% | 52.4% |
| Maximum | 10.8% | 100.0% |
| Range | 10.8% | 47.6% |
| Mean | 2.4% | 80.4% |
| Median | 1.7% | 83.2% |
| Interquartile 25% (IQ1) | 0.86% | 74.4% |
| Interquartile 75% (IQ3) | 3.1% | 86.8% |
| Interquartile Range (IQR) | 2.3% | 12.5% |
| Standard Deviation (Sample) | 2.2% | 10.2% |
| Standard Deviation (Population) | 2.1% | 10.1% |
Correlation Details
| Bahamian Percentile | Sample Size | GED/Equivalency |
[ 0.0% - 0.5% ] 0.017% | 79,575,663 | 83.5% |
[ 0.0% - 0.5% ] 0.077% | 12,683,415 | 86.5% |
[ 0.0% - 0.5% ] 0.13% | 6,207,123 | 84.7% |
[ 0.0% - 0.5% ] 0.19% | 3,578,302 | 86.5% |
[ 0.0% - 0.5% ] 0.24% | 1,431,054 | 85.4% |
[ 0.0% - 0.5% ] 0.29% | 1,862,752 | 84.1% |
[ 0.0% - 0.5% ] 0.35% | 892,171 | 85.2% |
[ 0.0% - 0.5% ] 0.40% | 749,143 | 84.6% |
[ 0.0% - 0.5% ] 0.46% | 707,966 | 83.3% |
[ 0.5% - 1.0% ] 0.51% | 751,899 | 87.8% |
[ 0.5% - 1.0% ] 0.57% | 569,471 | 86.0% |
[ 0.5% - 1.0% ] 0.62% | 510,579 | 88.6% |
[ 0.5% - 1.0% ] 0.67% | 574,611 | 84.9% |
[ 0.5% - 1.0% ] 0.73% | 287,663 | 83.2% |
[ 0.5% - 1.0% ] 0.79% | 221,731 | 83.9% |
[ 0.5% - 1.0% ] 0.84% | 264,243 | 82.8% |
[ 0.5% - 1.0% ] 0.88% | 135,630 | 83.4% |
[ 0.5% - 1.0% ] 0.94% | 190,813 | 80.0% |
[ 0.5% - 1.0% ] 1.00% | 296,445 | 79.7% |
[ 1.0% - 1.5% ] 1.05% | 70,662 | 76.2% |
[ 1.0% - 1.5% ] 1.12% | 46,612 | 87.6% |
[ 1.0% - 1.5% ] 1.15% | 60,436 | 75.3% |
[ 1.0% - 1.5% ] 1.23% | 31,590 | 70.9% |
[ 1.0% - 1.5% ] 1.27% | 109,884 | 85.3% |
[ 1.0% - 1.5% ] 1.33% | 74,297 | 81.2% |
[ 1.0% - 1.5% ] 1.36% | 25,473 | 73.6% |
[ 1.0% - 1.5% ] 1.42% | 19,010 | 63.7% |
[ 1.0% - 1.5% ] 1.48% | 145,059 | 79.6% |
[ 1.5% - 2.0% ] 1.52% | 179,180 | 78.9% |
[ 1.5% - 2.0% ] 1.60% | 3,247 | 97.3% |
[ 1.5% - 2.0% ] 1.62% | 48,077 | 81.3% |
[ 1.5% - 2.0% ] 1.70% | 86,097 | 83.9% |
[ 1.5% - 2.0% ] 1.78% | 338 | 78.9% |
[ 1.5% - 2.0% ] 1.86% | 1,506 | 100.0% |
[ 1.5% - 2.0% ] 1.91% | 47,981 | 77.5% |
[ 1.5% - 2.0% ] 1.98% | 15,208 | 85.8% |
[ 2.0% - 2.5% ] 2.01% | 947 | 91.6% |
[ 2.0% - 2.5% ] 2.07% | 8,340 | 52.4% |
[ 2.0% - 2.5% ] 2.15% | 37,274 | 81.2% |
[ 2.0% - 2.5% ] 2.26% | 2,349 | 75.6% |
[ 2.0% - 2.5% ] 2.37% | 7,689 | 87.5% |
[ 2.0% - 2.5% ] 2.40% | 16,449 | 87.7% |
[ 2.5% - 3.0% ] 2.51% | 3,192 | 67.1% |
[ 2.5% - 3.0% ] 2.64% | 2,576 | 78.3% |
[ 2.5% - 3.0% ] 2.73% | 48,792 | 72.8% |
[ 2.5% - 3.0% ] 2.88% | 27,583 | 93.1% |
[ 2.5% - 3.0% ] 2.95% | 847 | 64.3% |
[ 2.5% - 3.0% ] 2.98% | 6,266 | 75.1% |
[ 3.0% - 3.5% ] 3.30% | 7,385 | 73.5% |
[ 3.5% - 4.0% ] 3.64% | 9,677 | 87.1% |
[ 3.5% - 4.0% ] 3.74% | 1,950 | 69.9% |
[ 3.5% - 4.0% ] 3.81% | 18,487 | 68.4% |
[ 4.0% - 4.5% ] 4.14% | 1,714 | 65.8% |
[ 4.0% - 4.5% ] 4.34% | 8,118 | 87.5% |
[ 4.0% - 4.5% ] 4.48% | 15,735 | 89.9% |
[ 4.5% - 5.0% ] 4.89% | 2,190 | 92.5% |
[ 4.5% - 5.0% ] 4.97% | 2,151 | 94.5% |
[ 5.0% - 5.5% ] 5.07% | 2,426 | 96.7% |
[ 5.5% - 6.0% ] 5.90% | 305 | 71.4% |
[ 5.5% - 6.0% ] 5.97% | 486 | 65.2% |
[ 7.0% - 7.5% ] 7.21% | 14,698 | 69.5% |
[ 7.0% - 7.5% ] 7.32% | 1,011 | 58.1% |
[ 7.0% - 7.5% ] 7.45% | 1,651 | 94.4% |
[ 10.5% - 11.0% ] 10.78% | 1,540 | 53.1% |