Bahamian Married-couple Households
COMPARE
Bahamian
Select to Compare
Married-couple Households
Bahamian Married-couple Households
40.5%
MARRIED-COUPLE HOUSEHOLDS
0.0/ 100
METRIC RATING
319th/ 347
METRIC RANK
Bahamian Married-couple Households Correlation Chart
The statistical analysis conducted on geographies consisting of 112,634,221 people shows a weak negative correlation between the proportion of Bahamians and percentage of married-couple family households in the United States with a correlation coefficient (R) of -0.219 and weighted average of 40.5%. On average, for every 1% (one percent) increase in Bahamians within a typical geography, there is a decrease of 1.1% in percentage of married-couple family households.
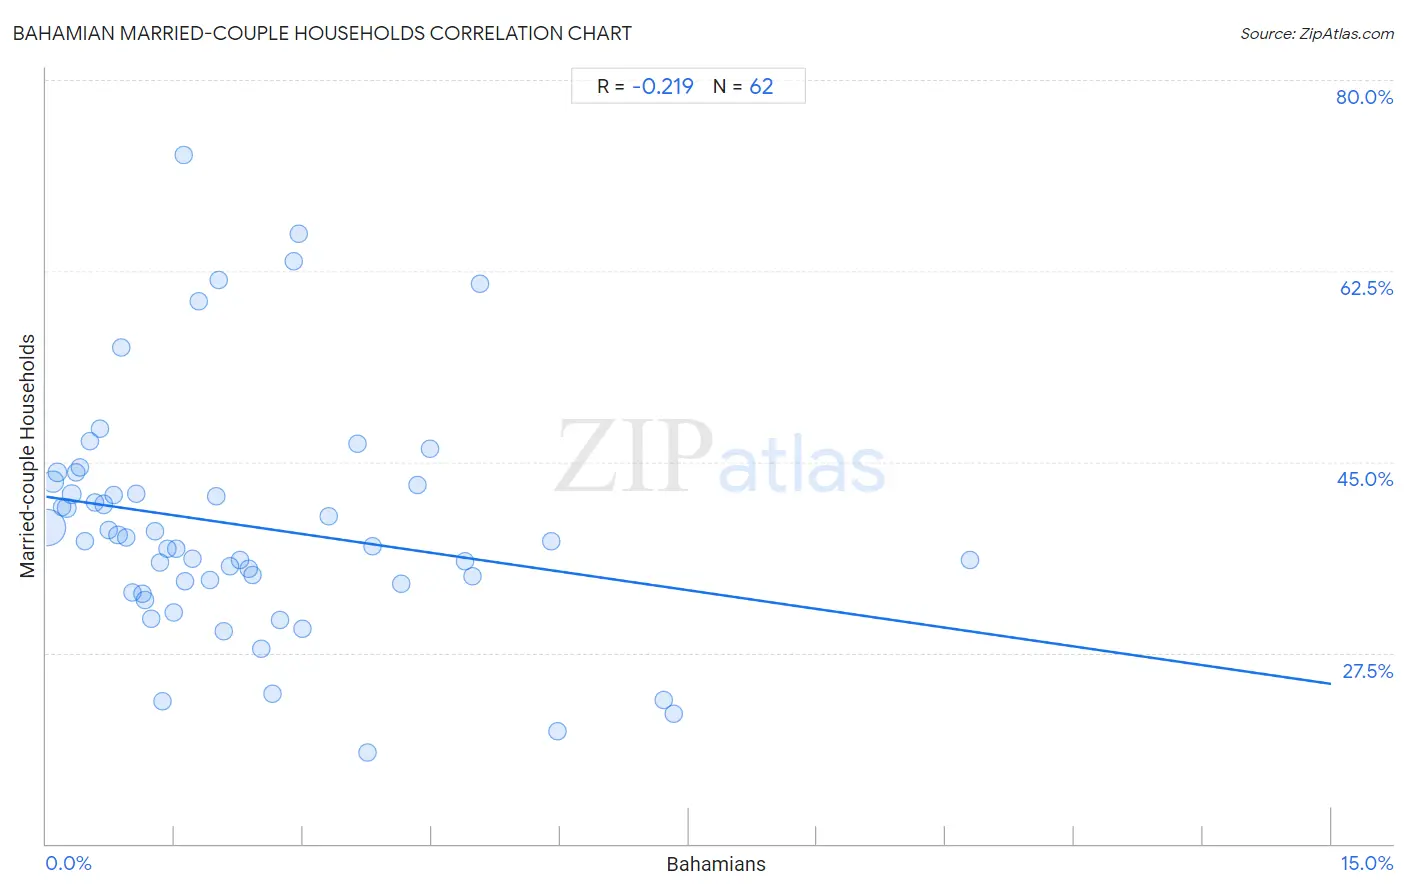
It is essential to understand that the correlation between the percentage of Bahamians and percentage of married-couple family households does not imply a direct cause-and-effect relationship. It remains uncertain whether the presence of Bahamians influences an upward or downward trend in the level of percentage of married-couple family households within an area, or if Bahamians simply ended up residing in those areas with higher or lower levels of percentage of married-couple family households due to other factors.
Demographics Similar to Bahamians by Married-couple Households
In terms of married-couple households, the demographic groups most similar to Bahamians are Liberian (40.7%, a difference of 0.35%), Immigrants from Jamaica (40.7%, a difference of 0.36%), West Indian (40.3%, a difference of 0.42%), Immigrants from Liberia (40.3%, a difference of 0.45%), and Immigrants from Caribbean (40.8%, a difference of 0.65%).
| Demographics | Rating | Rank | Married-couple Households |
| Africans | 0.0 /100 | #312 | Tragic 40.9% |
| Immigrants from Haiti | 0.0 /100 | #313 | Tragic 40.9% |
| Jamaicans | 0.0 /100 | #314 | Tragic 40.9% |
| Trinidadians and Tobagonians | 0.0 /100 | #315 | Tragic 40.9% |
| Immigrants from Caribbean | 0.0 /100 | #316 | Tragic 40.8% |
| Immigrants from Jamaica | 0.0 /100 | #317 | Tragic 40.7% |
| Liberians | 0.0 /100 | #318 | Tragic 40.7% |
| Bahamians | 0.0 /100 | #319 | Tragic 40.5% |
| West Indians | 0.0 /100 | #320 | Tragic 40.3% |
| Immigrants from Liberia | 0.0 /100 | #321 | Tragic 40.3% |
| Immigrants from Zaire | 0.0 /100 | #322 | Tragic 40.1% |
| Puerto Ricans | 0.0 /100 | #323 | Tragic 40.1% |
| Navajo | 0.0 /100 | #324 | Tragic 40.1% |
| Pueblo | 0.0 /100 | #325 | Tragic 40.0% |
| U.S. Virgin Islanders | 0.0 /100 | #326 | Tragic 39.8% |
Bahamian Married-couple Households Correlation Summary
| Measurement | Bahamian Data | Married-couple Households Data |
| Minimum | 0.017% | 18.4% |
| Maximum | 10.8% | 73.1% |
| Range | 10.8% | 54.8% |
| Mean | 2.3% | 39.2% |
| Median | 1.7% | 37.7% |
| Interquartile 25% (IQ1) | 0.84% | 33.9% |
| Interquartile 75% (IQ3) | 3.0% | 42.9% |
| Interquartile Range (IQR) | 2.1% | 9.0% |
| Standard Deviation (Sample) | 2.1% | 10.9% |
| Standard Deviation (Population) | 2.1% | 10.8% |
Correlation Details
| Bahamian Percentile | Sample Size | Married-couple Households |
[ 0.0% - 0.5% ] 0.017% | 79,566,586 | 38.9% |
[ 0.0% - 0.5% ] 0.077% | 12,663,415 | 43.2% |
[ 0.0% - 0.5% ] 0.13% | 6,207,123 | 44.0% |
[ 0.0% - 0.5% ] 0.19% | 3,566,355 | 40.9% |
[ 0.0% - 0.5% ] 0.24% | 1,427,342 | 40.8% |
[ 0.0% - 0.5% ] 0.29% | 1,862,752 | 42.0% |
[ 0.0% - 0.5% ] 0.35% | 892,171 | 44.0% |
[ 0.0% - 0.5% ] 0.40% | 749,143 | 44.5% |
[ 0.0% - 0.5% ] 0.46% | 706,201 | 37.7% |
[ 0.5% - 1.0% ] 0.51% | 745,618 | 46.9% |
[ 0.5% - 1.0% ] 0.57% | 565,412 | 41.3% |
[ 0.5% - 1.0% ] 0.62% | 509,767 | 48.1% |
[ 0.5% - 1.0% ] 0.67% | 574,611 | 41.1% |
[ 0.5% - 1.0% ] 0.73% | 283,431 | 38.7% |
[ 0.5% - 1.0% ] 0.79% | 221,731 | 42.0% |
[ 0.5% - 1.0% ] 0.84% | 264,243 | 38.3% |
[ 0.5% - 1.0% ] 0.88% | 132,873 | 55.5% |
[ 0.5% - 1.0% ] 0.94% | 189,649 | 38.1% |
[ 0.5% - 1.0% ] 1.00% | 296,445 | 33.0% |
[ 1.0% - 1.5% ] 1.05% | 70,662 | 42.1% |
[ 1.0% - 1.5% ] 1.12% | 46,612 | 32.9% |
[ 1.0% - 1.5% ] 1.15% | 60,436 | 32.3% |
[ 1.0% - 1.5% ] 1.23% | 31,590 | 30.6% |
[ 1.0% - 1.5% ] 1.27% | 109,405 | 38.7% |
[ 1.0% - 1.5% ] 1.33% | 74,297 | 35.8% |
[ 1.0% - 1.5% ] 1.36% | 25,473 | 23.1% |
[ 1.0% - 1.5% ] 1.42% | 19,010 | 37.0% |
[ 1.0% - 1.5% ] 1.48% | 145,059 | 31.2% |
[ 1.5% - 2.0% ] 1.52% | 176,766 | 37.1% |
[ 1.5% - 2.0% ] 1.60% | 3,247 | 73.1% |
[ 1.5% - 2.0% ] 1.62% | 48,077 | 34.1% |
[ 1.5% - 2.0% ] 1.70% | 86,097 | 36.1% |
[ 1.5% - 2.0% ] 1.78% | 338 | 59.7% |
[ 1.5% - 2.0% ] 1.91% | 47,981 | 34.2% |
[ 1.5% - 2.0% ] 1.98% | 14,126 | 41.9% |
[ 2.0% - 2.5% ] 2.01% | 947 | 61.6% |
[ 2.0% - 2.5% ] 2.07% | 8,340 | 29.5% |
[ 2.0% - 2.5% ] 2.15% | 37,274 | 35.4% |
[ 2.0% - 2.5% ] 2.26% | 2,349 | 36.1% |
[ 2.0% - 2.5% ] 2.37% | 7,689 | 35.2% |
[ 2.0% - 2.5% ] 2.40% | 16,449 | 34.6% |
[ 2.5% - 3.0% ] 2.51% | 3,192 | 27.9% |
[ 2.5% - 3.0% ] 2.64% | 2,576 | 23.8% |
[ 2.5% - 3.0% ] 2.73% | 48,792 | 30.5% |
[ 2.5% - 3.0% ] 2.88% | 27,583 | 63.4% |
[ 2.5% - 3.0% ] 2.95% | 847 | 65.9% |
[ 2.5% - 3.0% ] 2.98% | 6,266 | 29.7% |
[ 3.0% - 3.5% ] 3.30% | 7,385 | 40.0% |
[ 3.5% - 4.0% ] 3.64% | 9,677 | 46.7% |
[ 3.5% - 4.0% ] 3.74% | 1,950 | 18.4% |
[ 3.5% - 4.0% ] 3.81% | 18,487 | 37.3% |
[ 4.0% - 4.5% ] 4.14% | 1,714 | 33.9% |
[ 4.0% - 4.5% ] 4.34% | 8,118 | 42.9% |
[ 4.0% - 4.5% ] 4.48% | 15,735 | 46.2% |
[ 4.5% - 5.0% ] 4.89% | 2,190 | 35.9% |
[ 4.5% - 5.0% ] 4.97% | 2,151 | 34.6% |
[ 5.0% - 5.5% ] 5.07% | 2,426 | 61.4% |
[ 5.5% - 6.0% ] 5.90% | 305 | 37.7% |
[ 5.5% - 6.0% ] 5.97% | 486 | 20.3% |
[ 7.0% - 7.5% ] 7.21% | 14,698 | 23.2% |
[ 7.0% - 7.5% ] 7.32% | 1,011 | 21.9% |
[ 10.5% - 11.0% ] 10.78% | 1,540 | 36.0% |