Bahamian Female Disability
COMPARE
Bahamian
Select to Compare
Female Disability
Bahamian Female Disability
12.4%
DISABILITY | FEMALES
11.1/ 100
METRIC RATING
220th/ 347
METRIC RANK
Bahamian Female Disability Correlation Chart
The statistical analysis conducted on geographies consisting of 112,675,688 people shows a weak positive correlation between the proportion of Bahamians and percentage of females with a disability in the United States with a correlation coefficient (R) of 0.264 and weighted average of 12.4%. On average, for every 1% (one percent) increase in Bahamians within a typical geography, there is an increase of 0.69% in percentage of females with a disability.
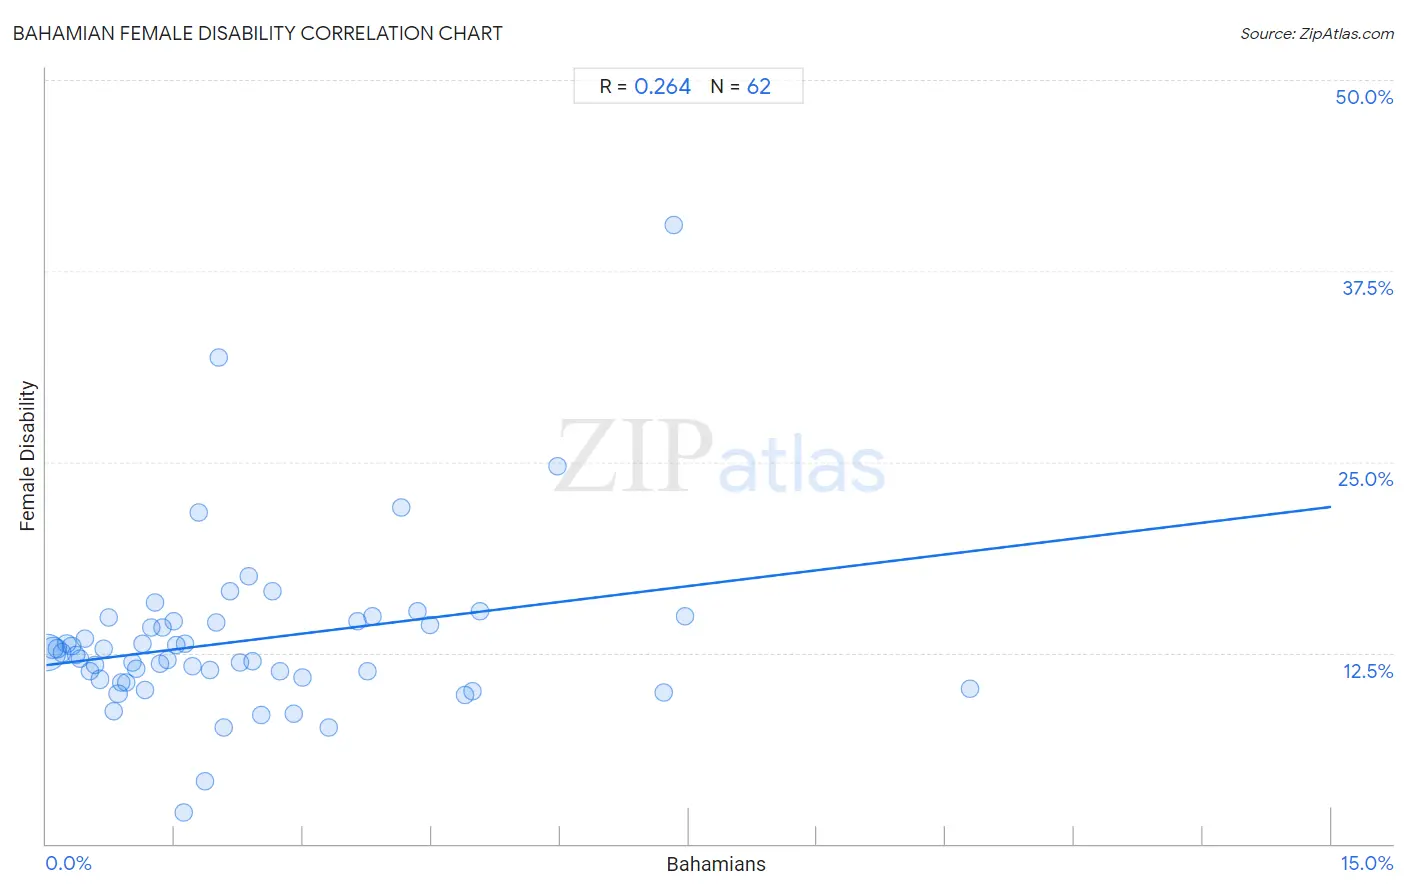
It is essential to understand that the correlation between the percentage of Bahamians and percentage of females with a disability does not imply a direct cause-and-effect relationship. It remains uncertain whether the presence of Bahamians influences an upward or downward trend in the level of percentage of females with a disability within an area, or if Bahamians simply ended up residing in those areas with higher or lower levels of percentage of females with a disability due to other factors.
Demographics Similar to Bahamians by Female Disability
In terms of female disability, the demographic groups most similar to Bahamians are Native Hawaiian (12.4%, a difference of 0.030%), Italian (12.4%, a difference of 0.040%), European (12.4%, a difference of 0.090%), Immigrants from Bahamas (12.4%, a difference of 0.12%), and British (12.4%, a difference of 0.14%).
| Demographics | Rating | Rank | Female Disability |
| Immigrants from Thailand | 14.5 /100 | #213 | Poor 12.4% |
| Panamanians | 13.5 /100 | #214 | Poor 12.4% |
| Samoans | 13.4 /100 | #215 | Poor 12.4% |
| Immigrants from Burma/Myanmar | 13.3 /100 | #216 | Poor 12.4% |
| British | 12.7 /100 | #217 | Poor 12.4% |
| Immigrants from Bahamas | 12.5 /100 | #218 | Poor 12.4% |
| Europeans | 12.1 /100 | #219 | Poor 12.4% |
| Bahamians | 11.1 /100 | #220 | Poor 12.4% |
| Native Hawaiians | 10.8 /100 | #221 | Poor 12.4% |
| Italians | 10.7 /100 | #222 | Poor 12.4% |
| Guamanians/Chamorros | 9.5 /100 | #223 | Tragic 12.5% |
| Belizeans | 9.3 /100 | #224 | Tragic 12.5% |
| Poles | 8.4 /100 | #225 | Tragic 12.5% |
| Hispanics or Latinos | 8.0 /100 | #226 | Tragic 12.5% |
| Assyrians/Chaldeans/Syriacs | 8.0 /100 | #227 | Tragic 12.5% |
Bahamian Female Disability Correlation Summary
| Measurement | Bahamian Data | Female Disability Data |
| Minimum | 0.017% | 2.1% |
| Maximum | 10.8% | 40.5% |
| Range | 10.8% | 38.4% |
| Mean | 2.3% | 13.3% |
| Median | 1.7% | 12.4% |
| Interquartile 25% (IQ1) | 0.84% | 10.8% |
| Interquartile 75% (IQ3) | 3.0% | 14.5% |
| Interquartile Range (IQR) | 2.1% | 3.8% |
| Standard Deviation (Sample) | 2.1% | 5.6% |
| Standard Deviation (Population) | 2.1% | 5.5% |
Correlation Details
| Bahamian Percentile | Sample Size | Female Disability |
[ 0.0% - 0.5% ] 0.017% | 79,575,663 | 12.5% |
[ 0.0% - 0.5% ] 0.077% | 12,673,785 | 12.8% |
[ 0.0% - 0.5% ] 0.13% | 6,207,123 | 12.8% |
[ 0.0% - 0.5% ] 0.19% | 3,568,339 | 12.5% |
[ 0.0% - 0.5% ] 0.24% | 1,429,466 | 13.1% |
[ 0.0% - 0.5% ] 0.29% | 1,862,752 | 12.9% |
[ 0.0% - 0.5% ] 0.35% | 892,171 | 12.4% |
[ 0.0% - 0.5% ] 0.40% | 749,143 | 12.1% |
[ 0.0% - 0.5% ] 0.46% | 707,966 | 13.4% |
[ 0.5% - 1.0% ] 0.51% | 747,421 | 11.3% |
[ 0.5% - 1.0% ] 0.57% | 569,471 | 11.7% |
[ 0.5% - 1.0% ] 0.62% | 510,579 | 10.8% |
[ 0.5% - 1.0% ] 0.67% | 574,611 | 12.8% |
[ 0.5% - 1.0% ] 0.73% | 287,663 | 14.8% |
[ 0.5% - 1.0% ] 0.79% | 221,731 | 8.6% |
[ 0.5% - 1.0% ] 0.84% | 264,243 | 9.8% |
[ 0.5% - 1.0% ] 0.88% | 135,630 | 10.6% |
[ 0.5% - 1.0% ] 0.94% | 189,649 | 10.6% |
[ 0.5% - 1.0% ] 1.00% | 296,445 | 11.9% |
[ 1.0% - 1.5% ] 1.05% | 70,662 | 11.5% |
[ 1.0% - 1.5% ] 1.12% | 46,612 | 13.1% |
[ 1.0% - 1.5% ] 1.15% | 60,436 | 10.1% |
[ 1.0% - 1.5% ] 1.23% | 31,590 | 14.1% |
[ 1.0% - 1.5% ] 1.27% | 109,884 | 15.8% |
[ 1.0% - 1.5% ] 1.33% | 74,297 | 11.7% |
[ 1.0% - 1.5% ] 1.36% | 25,473 | 14.1% |
[ 1.0% - 1.5% ] 1.42% | 19,010 | 12.1% |
[ 1.0% - 1.5% ] 1.48% | 145,059 | 14.5% |
[ 1.5% - 2.0% ] 1.52% | 176,766 | 13.0% |
[ 1.5% - 2.0% ] 1.60% | 3,247 | 2.1% |
[ 1.5% - 2.0% ] 1.62% | 48,077 | 13.1% |
[ 1.5% - 2.0% ] 1.70% | 86,097 | 11.6% |
[ 1.5% - 2.0% ] 1.78% | 338 | 21.7% |
[ 1.5% - 2.0% ] 1.86% | 1,506 | 4.1% |
[ 1.5% - 2.0% ] 1.91% | 47,981 | 11.3% |
[ 1.5% - 2.0% ] 1.98% | 14,126 | 14.5% |
[ 2.0% - 2.5% ] 2.01% | 947 | 31.8% |
[ 2.0% - 2.5% ] 2.07% | 8,340 | 7.6% |
[ 2.0% - 2.5% ] 2.15% | 37,274 | 16.5% |
[ 2.0% - 2.5% ] 2.26% | 2,349 | 11.9% |
[ 2.0% - 2.5% ] 2.37% | 7,689 | 17.5% |
[ 2.0% - 2.5% ] 2.40% | 16,449 | 11.9% |
[ 2.5% - 3.0% ] 2.51% | 3,192 | 8.4% |
[ 2.5% - 3.0% ] 2.64% | 2,576 | 16.5% |
[ 2.5% - 3.0% ] 2.73% | 48,792 | 11.3% |
[ 2.5% - 3.0% ] 2.88% | 27,583 | 8.5% |
[ 2.5% - 3.0% ] 2.98% | 6,266 | 10.9% |
[ 3.0% - 3.5% ] 3.30% | 7,385 | 7.6% |
[ 3.5% - 4.0% ] 3.64% | 9,677 | 14.5% |
[ 3.5% - 4.0% ] 3.74% | 1,950 | 11.3% |
[ 3.5% - 4.0% ] 3.81% | 18,487 | 14.9% |
[ 4.0% - 4.5% ] 4.14% | 1,714 | 22.0% |
[ 4.0% - 4.5% ] 4.34% | 8,118 | 15.3% |
[ 4.0% - 4.5% ] 4.48% | 15,735 | 14.4% |
[ 4.5% - 5.0% ] 4.89% | 2,190 | 9.7% |
[ 4.5% - 5.0% ] 4.97% | 2,151 | 10.0% |
[ 5.0% - 5.5% ] 5.07% | 2,426 | 15.2% |
[ 5.5% - 6.0% ] 5.97% | 486 | 24.7% |
[ 7.0% - 7.5% ] 7.21% | 14,698 | 9.9% |
[ 7.0% - 7.5% ] 7.32% | 1,011 | 40.5% |
[ 7.0% - 7.5% ] 7.45% | 1,651 | 14.9% |
[ 10.5% - 11.0% ] 10.78% | 1,540 | 10.1% |