Alaskan Athabascan Married-Couple Family Poverty

COMPARE

Alaskan Athabascan
Race
Ancestry
AfghanAfricanAlaska NativeAlaskan AthabascanAlbanianAleutAlsatianAmericanApacheArabArapahoArgentineanArmenianAssyrian/Chaldean/SyriacAustralianAustrianBahamianBangladeshiBarbadianBasqueBelgianBelizeanBermudanBhutaneseBlackfeetBolivianBrazilianBritishBritish West IndianBulgarianBurmeseCajunCambodianCanadianCape VerdeanCarpatho RusynCelticCentral AmericanCentral American IndianCherokeeCheyenneChickasawChileanChineseChippewaChoctawColombianColvilleComancheCosta RicanCreeCreekCroatianCrowCubanCypriotCzechCzechoslovakianDanishDelawareDominicanDutchDutch West IndianEastern EuropeanEcuadorianEgyptianEnglishEstonianEthiopianEuropeanFijianFilipinoFinnishFrenchFrench American IndianFrench CanadianGermanGerman RussianGhanaianGreekGuamanian/ChamorroGuatemalanGuyaneseHaitianHmongHonduranHopiHoumaHungarianIcelanderIndian (Asian)IndonesianInupiatIranianIraqiIrishIroquoisIsraeliItalianJamaicanJapaneseJordanianKenyanKiowaKoreanLaotianLatvianLebaneseLiberianLithuanianLumbeeLuxembourgerMacedonianMalaysianMalteseMarshalleseMenomineeMexicanMexican American IndianMongolianMoroccanNative HawaiianNavajoNepaleseNew ZealanderNicaraguanNigerianNorthern EuropeanNorwegianOkinawanOsageOttawaPaiutePakistaniPalestinianPanamanianParaguayanPennsylvania GermanPeruvianPimaPolishPortuguesePotawatomiPuebloPuerto RicanPuget Sound SalishRomanianRussianSalvadoranSamoanScandinavianScotch-IrishScottishSeminoleSenegaleseSerbianShoshoneSierra LeoneanSiouxSlavicSlovakSloveneSomaliSouth AfricanSouth AmericanSouth American IndianSoviet UnionSpaniardSpanishSpanish AmericanSpanish American IndianSri LankanSubsaharan AfricanSudaneseSwedishSwissSyrianTaiwaneseThaiTlingit-HaidaTohono O'OdhamTonganTrinidadian and TobagonianTsimshianTurkishU.S. Virgin IslanderUgandanUkrainianUruguayanUteVenezuelanVietnameseWelshWest IndianYakamaYaquiYugoslavianYumanYup'ikZimbabwean
Immigration
NonimmigrantsImmigrantsAfghanistanAfricaAlbaniaArgentinaArmeniaAsiaAustraliaAustriaBahamasBangladeshBarbadosBelarusBelgiumBelizeBoliviaBosnia and HerzegovinaBrazilBulgariaBurma/MyanmarCabo VerdeCambodiaCameroonCanadaCaribbeanCentral AmericaChileChinaColombiaCongoCosta RicaCroatiaCubaCzechoslovakiaDenmarkDominicaDominican RepublicEastern AfricaEastern AsiaEastern EuropeEcuadorEgyptEl SalvadorEnglandEritreaEthiopiaEuropeFijiFranceGermanyGhanaGreeceGrenadaGuatemalaGuyanaHaitiHondurasHong KongHungaryIndiaIndonesiaIranIraqIrelandIsraelItalyJamaicaJapanJordanKazakhstanKenyaKoreaKuwaitLaosLatin AmericaLatviaLebanonLiberiaLithuaniaMalaysiaMexicoMicronesiaMiddle AfricaMoldovaMoroccoNepalNetherlandsNicaraguaNigeriaNorth AmericaNorth MacedoniaNorthern AfricaNorthern EuropeNorwayOceaniaPakistanPanamaPeruPhilippinesPolandPortugalRomaniaRussiaSaudi ArabiaScotlandSenegalSerbiaSierra LeoneSingaporeSomaliaSouth AfricaSouth AmericaSouth Central AsiaSouth Eastern AsiaSouthern EuropeSpainSri LankaSt. Vincent and the GrenadinesSudanSwedenSwitzerlandSyriaTaiwanThailandTrinidad and TobagoTurkeyUgandaUkraineUruguayUzbekistanVenezuelaVietnamWest IndiesWestern AfricaWestern AsiaWestern EuropeYemenZaireZimbabweAzores
Select to Compare
Race
Ancestry
AfghanAfricanAlaska NativeAlbanianAleutAlsatianAmericanApacheArabArapahoArgentineanArmenianAssyrian/Chaldean/SyriacAustralianAustrianBahamianBangladeshiBarbadianBasqueBelgianBelizeanBermudanBhutaneseBlackfeetBolivianBrazilianBritishBritish West IndianBulgarianBurmeseCajunCambodianCanadianCape VerdeanCarpatho RusynCelticCentral AmericanCentral American IndianCherokeeCheyenneChickasawChileanChineseChippewaChoctawColombianColvilleComancheCosta RicanCreeCreekCroatianCrowCubanCypriotCzechCzechoslovakianDanishDelawareDominicanDutchDutch West IndianEastern EuropeanEcuadorianEgyptianEnglishEstonianEthiopianEuropeanFijianFilipinoFinnishFrenchFrench American IndianFrench CanadianGermanGerman RussianGhanaianGreekGuamanian/ChamorroGuatemalanGuyaneseHaitianHmongHonduranHopiHoumaHungarianIcelanderIndian (Asian)IndonesianInupiatIranianIraqiIrishIroquoisIsraeliItalianJamaicanJapaneseJordanianKenyanKiowaKoreanLaotianLatvianLebaneseLiberianLithuanianLumbeeLuxembourgerMacedonianMalaysianMalteseMarshalleseMenomineeMexicanMexican American IndianMongolianMoroccanNative HawaiianNavajoNepaleseNew ZealanderNicaraguanNigerianNorthern EuropeanNorwegianOkinawanOsageOttawaPaiutePakistaniPalestinianPanamanianParaguayanPennsylvania GermanPeruvianPimaPolishPortuguesePotawatomiPuebloPuerto RicanPuget Sound SalishRomanianRussianSalvadoranSamoanScandinavianScotch-IrishScottishSeminoleSenegaleseSerbianShoshoneSierra LeoneanSiouxSlavicSlovakSloveneSomaliSouth AfricanSouth AmericanSouth American IndianSoviet UnionSpaniardSpanishSpanish AmericanSpanish American IndianSri LankanSubsaharan AfricanSudaneseSwedishSwissSyrianTaiwaneseThaiTlingit-HaidaTohono O'OdhamTonganTrinidadian and TobagonianTsimshianTurkishU.S. Virgin IslanderUgandanUkrainianUruguayanUteVenezuelanVietnameseWelshWest IndianYakamaYaquiYugoslavianYumanYup'ikZimbabwean
Immigration
NonimmigrantsImmigrantsAfghanistanAfricaAlbaniaArgentinaArmeniaAsiaAustraliaAustriaBahamasBangladeshBarbadosBelarusBelgiumBelizeBoliviaBosnia and HerzegovinaBrazilBulgariaBurma/MyanmarCabo VerdeCambodiaCameroonCanadaCaribbeanCentral AmericaChileChinaColombiaCongoCosta RicaCroatiaCubaCzechoslovakiaDenmarkDominicaDominican RepublicEastern AfricaEastern AsiaEastern EuropeEcuadorEgyptEl SalvadorEnglandEritreaEthiopiaEuropeFijiFranceGermanyGhanaGreeceGrenadaGuatemalaGuyanaHaitiHondurasHong KongHungaryIndiaIndonesiaIranIraqIrelandIsraelItalyJamaicaJapanJordanKazakhstanKenyaKoreaKuwaitLaosLatin AmericaLatviaLebanonLiberiaLithuaniaMalaysiaMexicoMicronesiaMiddle AfricaMoldovaMoroccoNepalNetherlandsNicaraguaNigeriaNorth AmericaNorth MacedoniaNorthern AfricaNorthern EuropeNorwayOceaniaPakistanPanamaPeruPhilippinesPolandPortugalRomaniaRussiaSaudi ArabiaScotlandSenegalSerbiaSierra LeoneSingaporeSomaliaSouth AfricaSouth AmericaSouth Central AsiaSouth Eastern AsiaSouthern EuropeSpainSri LankaSt. Vincent and the GrenadinesSudanSwedenSwitzerlandSyriaTaiwanThailandTrinidad and TobagoTurkeyUgandaUkraineUruguayUzbekistanVenezuelaVietnamWest IndiesWestern AfricaWestern AsiaWestern EuropeYemenZaireZimbabweAzores
Married-Couple Family Poverty
Income
Poverty
Unemployment
Labor Participation
Family Structure
Vehicle Availability
Education Level
Disability

Alaskan Athabascan Married-Couple Family Poverty
Tragic

6.1%
POVERTY | MARRIED-COUPLE FAMILIES
0.4/ 100
METRIC RATING
259th/ 347
METRIC RANK

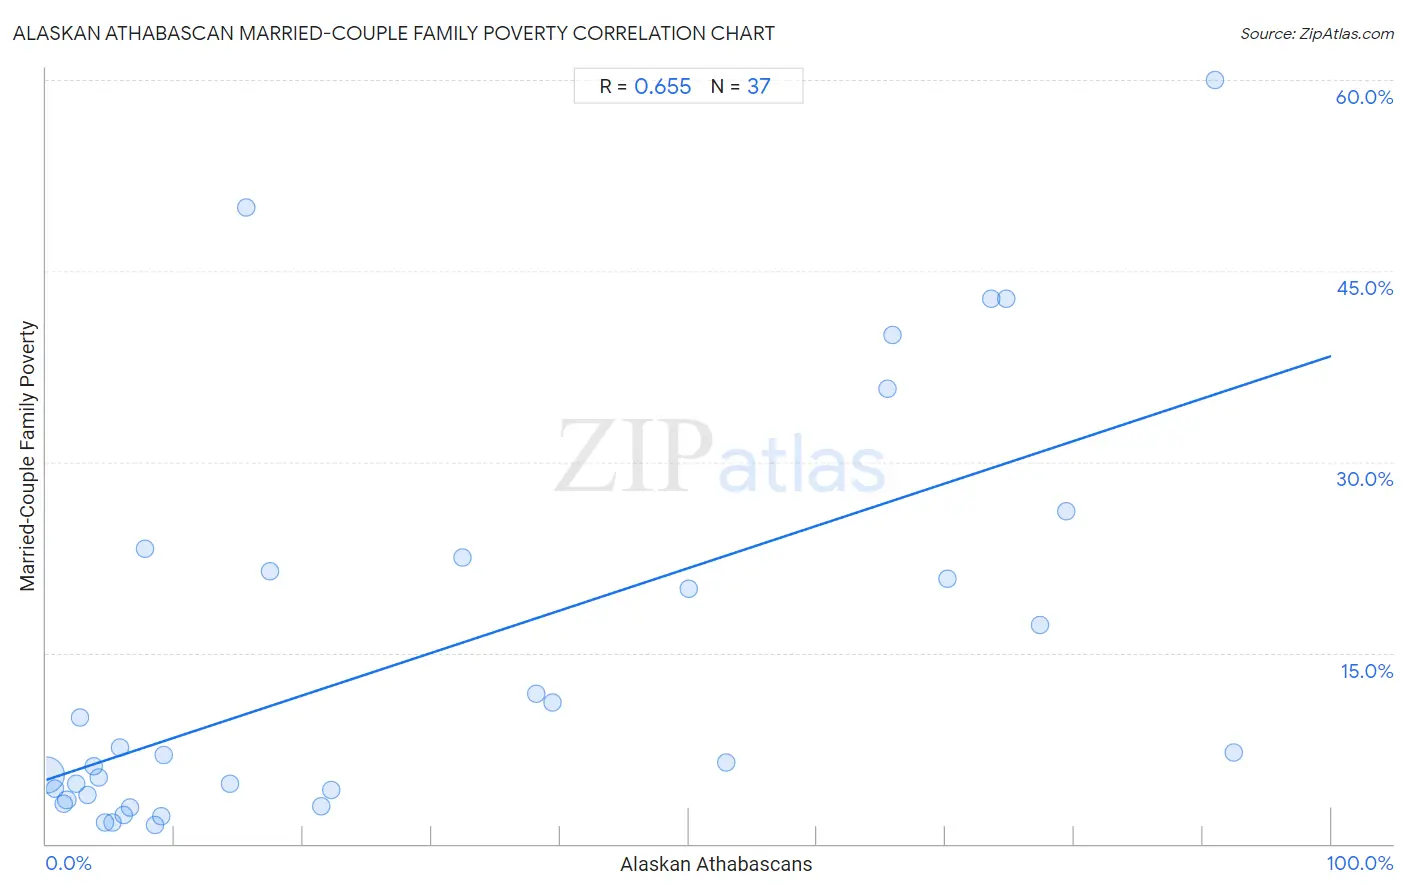
Alaskan Athabascan Married-Couple Family Poverty Correlation Chart

The statistical analysis conducted on geographies consisting of 45,695,743 people shows a significant positive correlation between the proportion of Alaskan Athabascans and poverty level among married-couple families in the United States with a correlation coefficient (R) of 0.655 and weighted average of 6.1%. On average, for every 1% (one percent) increase in Alaskan Athabascans within a typical geography, there is an increase of 0.33% in poverty level among married-couple families.
Alaskan Athabascan Married-Couple Family Poverty
It is essential to understand that the correlation between the percentage of Alaskan Athabascans and poverty level among married-couple families does not imply a direct cause-and-effect relationship. It remains uncertain whether the presence of Alaskan Athabascans influences an upward or downward trend in the level of poverty level among married-couple families within an area, or if Alaskan Athabascans simply ended up residing in those areas with higher or lower levels of poverty level among married-couple families due to other factors.

Demographics Similar to Alaskan Athabascans by Married-Couple Family Poverty

In terms of married-couple family poverty, the demographic groups most similar to Alaskan Athabascans are Jamaican (6.1%, a difference of 0.21%), Senegalese (6.1%, a difference of 0.40%), Immigrants (6.0%, a difference of 0.58%), Shoshone (6.1%, a difference of 0.61%), and Immigrants from Burma/Myanmar (6.0%, a difference of 0.71%).
DemographicsRating | RankMarried-Couple Family Poverty
Immigrants from Western Asia
0.7
/100
|
#252
Tragic
6.0%
Africans
0.7
/100
|
#253
Tragic
6.0%
Immigrants from Somalia
0.7
/100
|
#254
Tragic
6.0%
Comanche
0.7
/100
|
#255
Tragic
6.0%
Bangladeshis
0.5
/100
|
#256
Tragic
6.0%
Immigrants from Burma/Myanmar
0.5
/100
|
#257
Tragic
6.0%
Immigrants
0.5
/100
|
#258
Tragic
6.0%
Alaskan Athabascans
0.4
/100
|
#259
Tragic
6.1%
Jamaicans
0.3
/100
|
#260
Tragic
6.1%
Senegalese
0.3
/100
|
#261
Tragic
6.1%
Shoshone
0.3
/100
|
#262
Tragic
6.1%
Immigrants from Senegal
0.3
/100
|
#263
Tragic
6.1%
Immigrants from Congo
0.2
/100
|
#264
Tragic
6.1%
Blackfeet
0.2
/100
|
#265
Tragic
6.2%
Creek
0.2
/100
|
#266
Tragic
6.2%

Alaskan Athabascan Married-Couple Family Poverty Correlation Summary

MeasurementAlaskan Athabascan DataMarried-Couple Family Poverty Data
Minimum0.025%1.5%
Maximum92.4%60.0%
Range92.3%58.5%
Mean29.1%14.7%
Median14.3%7.0%
Interquartile 25% (IQ1)4.3%3.6%
Interquartile 75% (IQ3)59.2%21.9%
Interquartile Range (IQR)54.8%18.3%
Standard Deviation (Sample)30.7%15.6%
Standard Deviation (Population)30.3%15.4%

Correlation Details

Alaskan Athabascan PercentileSample SizeMarried-Couple Family Poverty
[
0.0%
-
0.5%
]
0.025%
44,489,4325.4%
[
0.5%
-
1.0%
]
0.67%
217,7374.3%
[
1.0%
-
1.5%
]
1.33%
103,8843.2%
[
1.5%
-
2.0%
]
1.59%
510,5163.4%
[
2.0%
-
2.5%
]
2.29%
152,0974.7%
[
2.5%
-
3.0%
]
2.63%
13,0229.9%
[
3.0%
-
3.5%
]
3.19%
79,6753.8%
[
3.5%
-
4.0%
]
3.72%
3,5796.1%
[
4.0%
-
4.5%
]
4.07%
16,1815.2%
[
4.5%
-
5.0%
]
4.61%
2,0611.7%
[
5.0%
-
5.5%
]
5.20%
29,2931.6%
[
5.5%
-
6.0%
]
5.72%
7,9217.5%
[
6.0%
-
6.5%
]
6.07%
1,1702.3%
[
6.5%
-
7.0%
]
6.56%
33,2112.8%
[
7.5%
-
8.0%
]
7.65%
40523.1%
[
8.0%
-
8.5%
]
8.49%
5,3211.5%
[
8.5%
-
9.0%
]
8.96%
19,5292.2%
[
9.0%
-
9.5%
]
9.13%
9647.0%
[
14.0%
-
14.5%
]
14.29%
1824.8%
[
15.5%
-
16.0%
]
15.52%
11650.0%
[
17.0%
-
17.5%
]
17.40%
1,75321.4%
[
21.0%
-
21.5%
]
21.39%
1,0523.0%
[
22.0%
-
22.5%
]
22.16%
3794.2%
[
32.0%
-
32.5%
]
32.34%
1,71922.5%
[
38.0%
-
38.5%
]
38.10%
52511.8%
[
39.0%
-
39.5%
]
39.44%
7111.1%
[
50.0%
-
50.5%
]
50.00%
43020.0%
[
52.5%
-
53.0%
]
52.89%
3296.4%
[
65.0%
-
65.5%
]
65.45%
22035.7%
[
65.5%
-
66.0%
]
65.85%
4140.0%
[
70.0%
-
70.5%
]
70.15%
65020.8%
[
73.5%
-
74.0%
]
73.56%
8742.9%
[
74.5%
-
75.0%
]
74.73%
9142.9%
[
77.0%
-
77.5%
]
77.31%
95217.1%
[
79.0%
-
79.5%
]
79.37%
25226.1%
[
90.5%
-
91.0%
]
90.95%
39860.0%
[
92.0%
-
92.5%
]
92.37%
4987.1%