Alaskan Athabascan Disability
COMPARE
Alaskan Athabascan
Select to Compare
Disability
Alaskan Athabascan Disability
14.4%
DISABILITY
0.0/ 100
METRIC RATING
331st/ 347
METRIC RANK
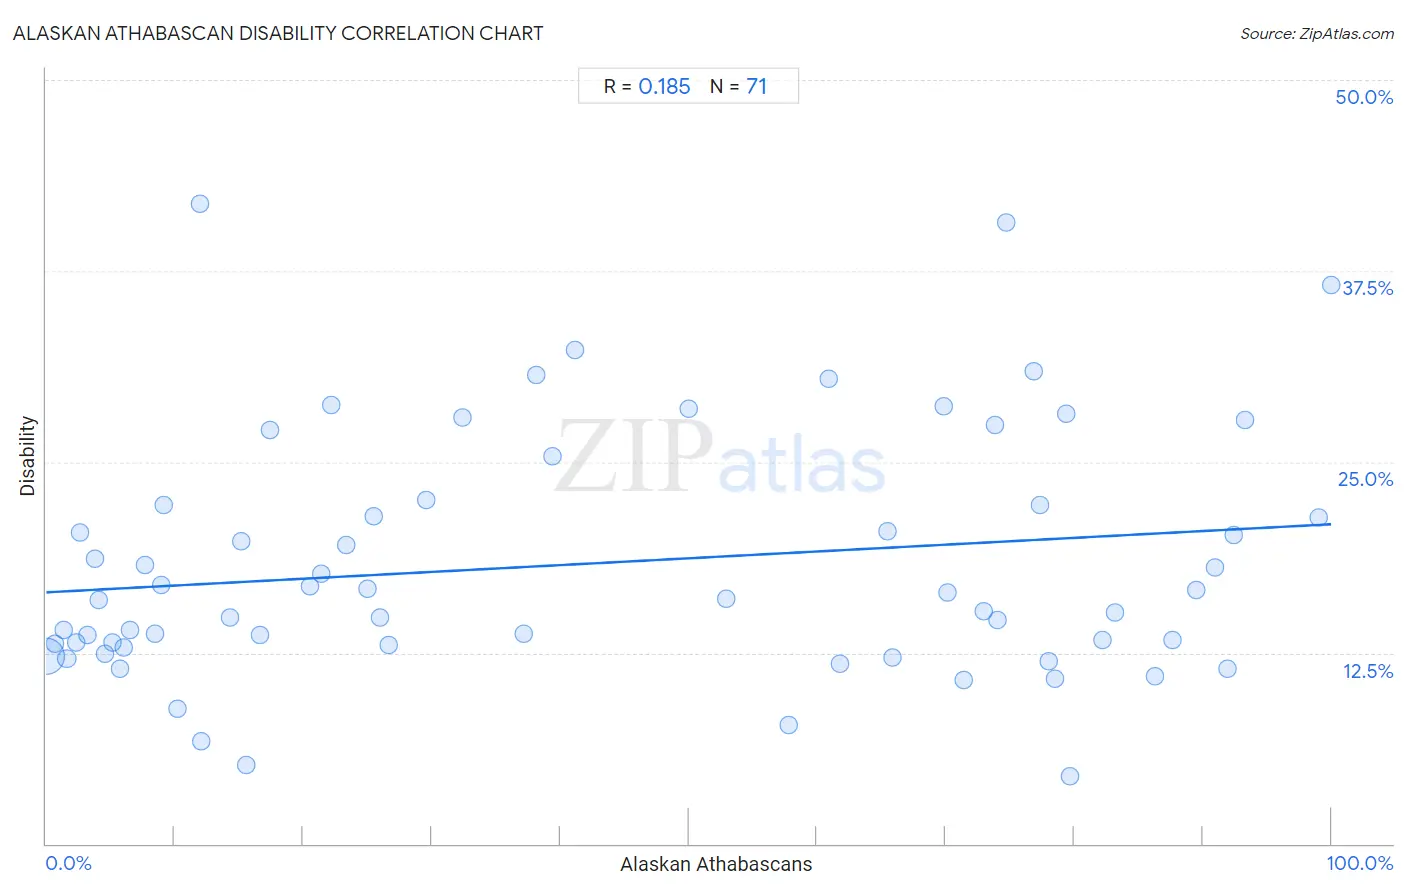
Alaskan Athabascan Disability Correlation Chart
The statistical analysis conducted on geographies consisting of 45,821,092 people shows a poor positive correlation between the proportion of Alaskan Athabascans and percentage of population with a disability in the United States with a correlation coefficient (R) of 0.185 and weighted average of 14.4%. On average, for every 1% (one percent) increase in Alaskan Athabascans within a typical geography, there is an increase of 0.045% in percentage of population with a disability.
It is essential to understand that the correlation between the percentage of Alaskan Athabascans and percentage of population with a disability does not imply a direct cause-and-effect relationship. It remains uncertain whether the presence of Alaskan Athabascans influences an upward or downward trend in the level of percentage of population with a disability within an area, or if Alaskan Athabascans simply ended up residing in those areas with higher or lower levels of percentage of population with a disability due to other factors.
Demographics Similar to Alaskan Athabascans by Disability
In terms of disability, the demographic groups most similar to Alaskan Athabascans are Pueblo (14.4%, a difference of 0.020%), Cajun (14.6%, a difference of 1.1%), Yuman (14.6%, a difference of 1.2%), Navajo (14.3%, a difference of 1.3%), and Potawatomi (14.2%, a difference of 1.9%).
| Demographics | Rating | Rank | Disability |
| Chippewa | 0.0 /100 | #324 | Tragic 14.1% |
| Natives/Alaskans | 0.0 /100 | #325 | Tragic 14.2% |
| Osage | 0.0 /100 | #326 | Tragic 14.2% |
| Ottawa | 0.0 /100 | #327 | Tragic 14.2% |
| Immigrants from the Azores | 0.0 /100 | #328 | Tragic 14.2% |
| Potawatomi | 0.0 /100 | #329 | Tragic 14.2% |
| Navajo | 0.0 /100 | #330 | Tragic 14.3% |
| Alaskan Athabascans | 0.0 /100 | #331 | Tragic 14.4% |
| Pueblo | 0.0 /100 | #332 | Tragic 14.4% |
| Cajuns | 0.0 /100 | #333 | Tragic 14.6% |
| Yuman | 0.0 /100 | #334 | Tragic 14.6% |
| Tohono O'odham | 0.0 /100 | #335 | Tragic 14.8% |
| Cherokee | 0.0 /100 | #336 | Tragic 14.8% |
| Seminole | 0.0 /100 | #337 | Tragic 14.9% |
| Dutch West Indians | 0.0 /100 | #338 | Tragic 14.9% |
Alaskan Athabascan Disability Correlation Summary
| Measurement | Alaskan Athabascan Data | Disability Data |
| Minimum | 0.025% | 4.4% |
| Maximum | 100.0% | 41.9% |
| Range | 100.0% | 37.5% |
| Mean | 42.1% | 18.3% |
| Median | 32.3% | 16.0% |
| Interquartile 25% (IQ1) | 9.1% | 13.0% |
| Interquartile 75% (IQ3) | 74.7% | 22.2% |
| Interquartile Range (IQR) | 65.6% | 9.2% |
| Standard Deviation (Sample) | 33.3% | 8.0% |
| Standard Deviation (Population) | 33.1% | 8.0% |
Correlation Details
| Alaskan Athabascan Percentile | Sample Size | Disability |
[ 0.0% - 0.5% ] 0.025% | 44,547,940 | 12.3% |
[ 0.5% - 1.0% ] 0.67% | 230,145 | 13.1% |
[ 1.0% - 1.5% ] 1.34% | 116,887 | 14.0% |
[ 1.5% - 2.0% ] 1.59% | 514,725 | 12.1% |
[ 2.0% - 2.5% ] 2.29% | 152,758 | 13.2% |
[ 2.5% - 3.0% ] 2.63% | 14,176 | 20.4% |
[ 3.0% - 3.5% ] 3.19% | 79,978 | 13.6% |
[ 3.5% - 4.0% ] 3.81% | 6,568 | 18.6% |
[ 4.0% - 4.5% ] 4.09% | 18,102 | 16.0% |
[ 4.5% - 5.0% ] 4.61% | 2,061 | 12.4% |
[ 5.0% - 5.5% ] 5.20% | 29,293 | 13.2% |
[ 5.5% - 6.0% ] 5.76% | 20,604 | 11.5% |
[ 6.0% - 6.5% ] 6.07% | 1,170 | 12.8% |
[ 6.5% - 7.0% ] 6.56% | 33,211 | 14.0% |
[ 7.5% - 8.0% ] 7.65% | 405 | 18.3% |
[ 8.0% - 8.5% ] 8.49% | 5,499 | 13.7% |
[ 8.5% - 9.0% ] 8.96% | 19,529 | 16.9% |
[ 9.0% - 9.5% ] 9.13% | 964 | 22.2% |
[ 10.0% - 10.5% ] 10.26% | 6,542 | 8.8% |
[ 11.5% - 12.0% ] 11.97% | 234 | 41.9% |
[ 12.0% - 12.5% ] 12.01% | 283 | 6.7% |
[ 14.0% - 14.5% ] 14.29% | 182 | 14.8% |
[ 15.0% - 15.5% ] 15.22% | 92 | 19.8% |
[ 15.5% - 16.0% ] 15.52% | 116 | 5.2% |
[ 16.5% - 17.0% ] 16.60% | 235 | 13.7% |
[ 17.0% - 17.5% ] 17.38% | 1,927 | 27.1% |
[ 20.5% - 21.0% ] 20.57% | 1,167 | 16.9% |
[ 21.0% - 21.5% ] 21.39% | 1,052 | 17.7% |
[ 22.0% - 22.5% ] 22.16% | 388 | 28.8% |
[ 23.0% - 23.5% ] 23.37% | 522 | 19.5% |
[ 25.0% - 25.5% ] 25.00% | 12 | 16.7% |
[ 25.0% - 25.5% ] 25.49% | 761 | 21.4% |
[ 25.5% - 26.0% ] 25.93% | 54 | 14.8% |
[ 26.5% - 27.0% ] 26.65% | 439 | 13.0% |
[ 29.5% - 30.0% ] 29.58% | 71 | 22.5% |
[ 32.0% - 32.5% ] 32.34% | 1,719 | 27.9% |
[ 37.0% - 37.5% ] 37.20% | 508 | 13.8% |
[ 38.0% - 38.5% ] 38.10% | 525 | 30.7% |
[ 39.0% - 39.5% ] 39.44% | 71 | 25.4% |
[ 41.0% - 41.5% ] 41.18% | 68 | 32.4% |
[ 50.0% - 50.5% ] 50.00% | 470 | 28.5% |
[ 52.5% - 53.0% ] 52.89% | 329 | 16.0% |
[ 57.5% - 58.0% ] 57.74% | 1,254 | 7.8% |
[ 60.5% - 61.0% ] 60.87% | 69 | 30.4% |
[ 61.5% - 62.0% ] 61.76% | 68 | 11.8% |
[ 65.0% - 65.5% ] 65.45% | 220 | 20.5% |
[ 65.5% - 66.0% ] 65.85% | 41 | 12.2% |
[ 69.5% - 70.0% ] 69.85% | 272 | 28.7% |
[ 70.0% - 70.5% ] 70.15% | 650 | 16.5% |
[ 71.0% - 71.5% ] 71.43% | 28 | 10.7% |
[ 72.5% - 73.0% ] 72.99% | 274 | 15.2% |
[ 73.5% - 74.0% ] 73.81% | 252 | 27.4% |
[ 74.0% - 74.5% ] 74.07% | 270 | 14.7% |
[ 74.5% - 75.0% ] 74.73% | 91 | 40.7% |
[ 76.5% - 77.0% ] 76.80% | 388 | 30.9% |
[ 77.0% - 77.5% ] 77.31% | 952 | 22.2% |
[ 77.5% - 78.0% ] 77.98% | 218 | 11.9% |
[ 78.0% - 78.5% ] 78.46% | 130 | 10.8% |
[ 79.0% - 79.5% ] 79.37% | 252 | 28.2% |
[ 79.5% - 80.0% ] 79.65% | 226 | 4.4% |
[ 82.0% - 82.5% ] 82.22% | 45 | 13.3% |
[ 83.0% - 83.5% ] 83.18% | 428 | 15.1% |
[ 86.0% - 86.5% ] 86.26% | 364 | 11.0% |
[ 87.5% - 88.0% ] 87.62% | 420 | 13.3% |
[ 89.5% - 90.0% ] 89.53% | 554 | 16.6% |
[ 90.5% - 91.0% ] 90.95% | 398 | 18.1% |
[ 91.5% - 92.0% ] 91.95% | 174 | 11.5% |
[ 92.0% - 92.5% ] 92.37% | 524 | 20.2% |
[ 93.0% - 93.5% ] 93.28% | 238 | 27.7% |
[ 99.0% - 99.5% ] 99.00% | 201 | 21.4% |
[ 99.5% - 100.0% ] 100.00% | 309 | 36.6% |