Alaskan Athabascan 3 or more Vehicles in Household
COMPARE
Alaskan Athabascan
Select to Compare
3 or more Vehicles in Household
Alaskan Athabascan 3 or more Vehicles in Household
21.9%
3+ VEHICLES AVAILABLE
99.9/ 100
METRIC RATING
67th/ 347
METRIC RANK
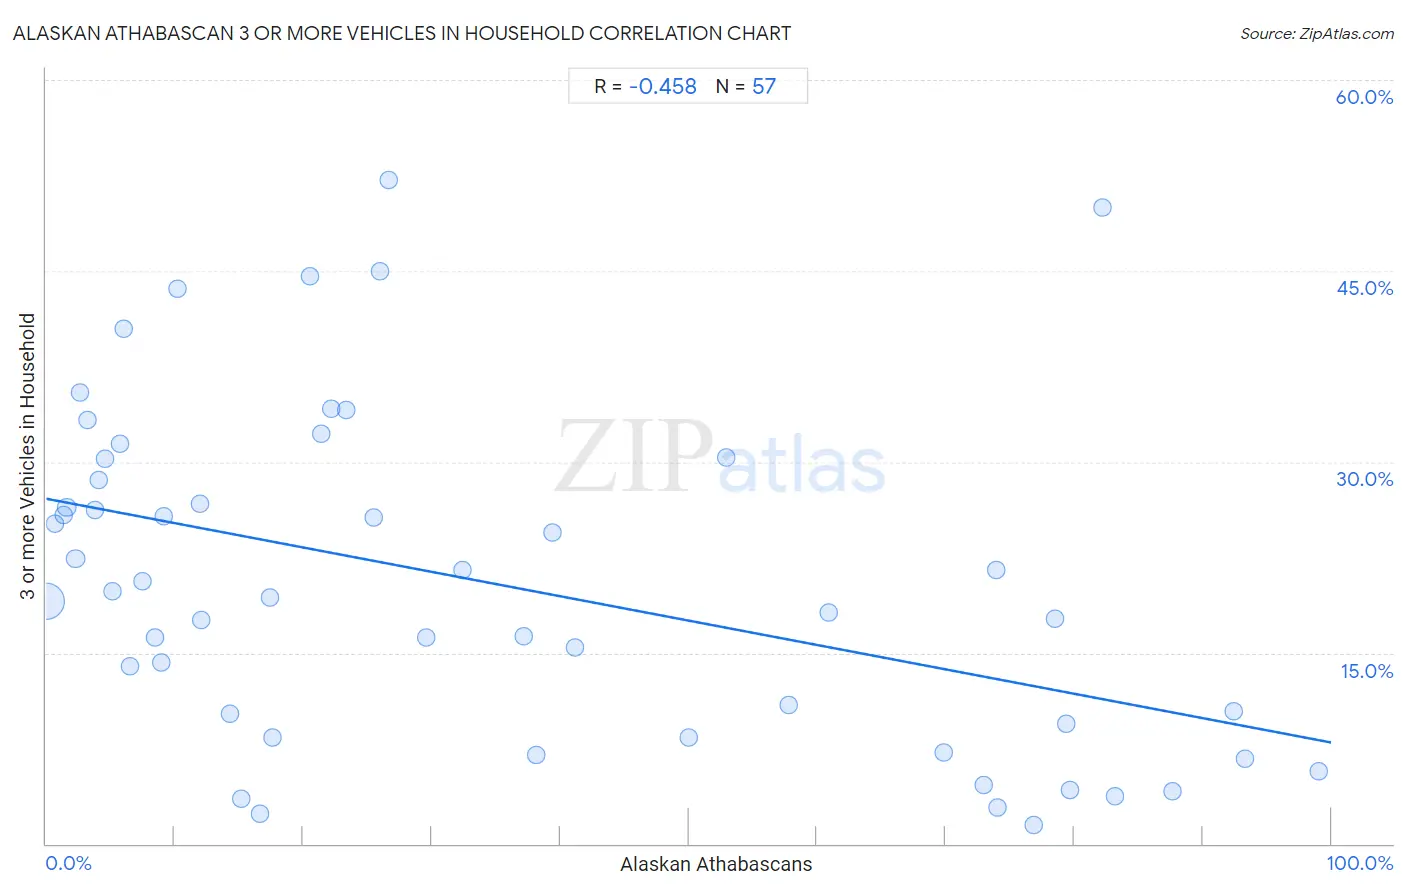
Alaskan Athabascan 3 or more Vehicles in Household Correlation Chart
The statistical analysis conducted on geographies consisting of 45,796,078 people shows a moderate negative correlation between the proportion of Alaskan Athabascans and percentage of households with 3 or more vehicles available in the United States with a correlation coefficient (R) of -0.458 and weighted average of 21.9%. On average, for every 1% (one percent) increase in Alaskan Athabascans within a typical geography, there is a decrease of 0.19% in percentage of households with 3 or more vehicles available.
It is essential to understand that the correlation between the percentage of Alaskan Athabascans and percentage of households with 3 or more vehicles available does not imply a direct cause-and-effect relationship. It remains uncertain whether the presence of Alaskan Athabascans influences an upward or downward trend in the level of percentage of households with 3 or more vehicles available within an area, or if Alaskan Athabascans simply ended up residing in those areas with higher or lower levels of percentage of households with 3 or more vehicles available due to other factors.
Demographics Similar to Alaskan Athabascans by 3 or more Vehicles in Household
In terms of 3 or more vehicles in household, the demographic groups most similar to Alaskan Athabascans are British (21.9%, a difference of 0.15%), Creek (21.9%, a difference of 0.18%), Northern European (22.0%, a difference of 0.26%), Bangladeshi (21.9%, a difference of 0.37%), and Potawatomi (21.9%, a difference of 0.38%).
| Demographics | Rating | Rank | 3 or more Vehicles in Household |
| Finns | 99.9 /100 | #60 | Exceptional 22.3% |
| Bhutanese | 99.9 /100 | #61 | Exceptional 22.2% |
| Fijians | 99.9 /100 | #62 | Exceptional 22.2% |
| Chickasaw | 99.9 /100 | #63 | Exceptional 22.2% |
| Immigrants from Taiwan | 99.9 /100 | #64 | Exceptional 22.1% |
| Pima | 99.9 /100 | #65 | Exceptional 22.0% |
| Northern Europeans | 99.9 /100 | #66 | Exceptional 22.0% |
| Alaskan Athabascans | 99.9 /100 | #67 | Exceptional 21.9% |
| British | 99.9 /100 | #68 | Exceptional 21.9% |
| Creek | 99.9 /100 | #69 | Exceptional 21.9% |
| Bangladeshis | 99.8 /100 | #70 | Exceptional 21.9% |
| Potawatomi | 99.8 /100 | #71 | Exceptional 21.9% |
| Portuguese | 99.8 /100 | #72 | Exceptional 21.8% |
| Salvadorans | 99.8 /100 | #73 | Exceptional 21.8% |
| Immigrants from Oceania | 99.8 /100 | #74 | Exceptional 21.8% |
Alaskan Athabascan 3 or more Vehicles in Household Correlation Summary
| Measurement | Alaskan Athabascan Data | 3 or more Vehicles in Household Data |
| Minimum | 0.025% | 1.4% |
| Maximum | 99.0% | 52.1% |
| Range | 99.0% | 50.7% |
| Mean | 34.1% | 20.6% |
| Median | 22.2% | 19.4% |
| Interquartile 25% (IQ1) | 7.0% | 8.9% |
| Interquartile 75% (IQ3) | 65.4% | 29.4% |
| Interquartile Range (IQR) | 58.3% | 20.5% |
| Standard Deviation (Sample) | 31.2% | 13.0% |
| Standard Deviation (Population) | 30.9% | 12.9% |
Correlation Details
| Alaskan Athabascan Percentile | Sample Size | 3 or more Vehicles in Household |
[ 0.0% - 0.5% ] 0.025% | 44,544,366 | 19.0% |
[ 0.5% - 1.0% ] 0.67% | 227,223 | 25.1% |
[ 1.0% - 1.5% ] 1.34% | 110,168 | 25.9% |
[ 1.5% - 2.0% ] 1.59% | 511,569 | 26.4% |
[ 2.0% - 2.5% ] 2.29% | 150,984 | 22.4% |
[ 2.5% - 3.0% ] 2.63% | 13,418 | 35.4% |
[ 3.0% - 3.5% ] 3.19% | 79,978 | 33.3% |
[ 3.5% - 4.0% ] 3.81% | 6,568 | 26.2% |
[ 4.0% - 4.5% ] 4.09% | 18,102 | 28.5% |
[ 4.5% - 5.0% ] 4.61% | 2,061 | 30.3% |
[ 5.0% - 5.5% ] 5.20% | 28,343 | 19.9% |
[ 5.5% - 6.0% ] 5.75% | 20,160 | 31.4% |
[ 6.0% - 6.5% ] 6.07% | 1,170 | 40.5% |
[ 6.5% - 7.0% ] 6.56% | 33,211 | 13.9% |
[ 7.5% - 8.0% ] 7.53% | 279 | 20.6% |
[ 8.0% - 8.5% ] 8.49% | 5,321 | 16.2% |
[ 8.5% - 9.0% ] 8.96% | 19,529 | 14.2% |
[ 9.0% - 9.5% ] 9.13% | 964 | 25.7% |
[ 10.0% - 10.5% ] 10.26% | 6,542 | 43.6% |
[ 11.5% - 12.0% ] 11.97% | 234 | 26.7% |
[ 12.0% - 12.5% ] 12.01% | 283 | 17.6% |
[ 14.0% - 14.5% ] 14.29% | 182 | 10.2% |
[ 15.0% - 15.5% ] 15.22% | 92 | 3.6% |
[ 16.5% - 17.0% ] 16.60% | 235 | 2.3% |
[ 17.0% - 17.5% ] 17.38% | 1,927 | 19.4% |
[ 17.5% - 18.0% ] 17.65% | 34 | 8.3% |
[ 20.5% - 21.0% ] 20.57% | 1,167 | 44.6% |
[ 21.0% - 21.5% ] 21.39% | 1,052 | 32.2% |
[ 22.0% - 22.5% ] 22.16% | 379 | 34.2% |
[ 23.0% - 23.5% ] 23.37% | 522 | 34.0% |
[ 25.0% - 25.5% ] 25.49% | 761 | 25.6% |
[ 25.5% - 26.0% ] 25.93% | 54 | 45.0% |
[ 26.5% - 27.0% ] 26.65% | 439 | 52.1% |
[ 29.5% - 30.0% ] 29.58% | 71 | 16.2% |
[ 32.0% - 32.5% ] 32.34% | 1,719 | 21.5% |
[ 37.0% - 37.5% ] 37.20% | 508 | 16.3% |
[ 38.0% - 38.5% ] 38.10% | 525 | 6.9% |
[ 39.0% - 39.5% ] 39.44% | 71 | 24.4% |
[ 41.0% - 41.5% ] 41.18% | 68 | 15.4% |
[ 50.0% - 50.5% ] 50.00% | 430 | 8.3% |
[ 52.5% - 53.0% ] 52.89% | 329 | 30.4% |
[ 57.5% - 58.0% ] 57.74% | 1,254 | 10.9% |
[ 60.5% - 61.0% ] 60.87% | 69 | 18.2% |
[ 69.5% - 70.0% ] 69.85% | 272 | 7.1% |
[ 72.5% - 73.0% ] 72.99% | 274 | 4.6% |
[ 73.5% - 74.0% ] 73.94% | 165 | 21.5% |
[ 74.0% - 74.5% ] 74.07% | 270 | 2.9% |
[ 76.5% - 77.0% ] 76.80% | 388 | 1.4% |
[ 78.0% - 78.5% ] 78.46% | 130 | 17.6% |
[ 79.0% - 79.5% ] 79.37% | 252 | 9.4% |
[ 79.5% - 80.0% ] 79.65% | 226 | 4.3% |
[ 82.0% - 82.5% ] 82.22% | 45 | 50.0% |
[ 83.0% - 83.5% ] 83.18% | 428 | 3.7% |
[ 87.5% - 88.0% ] 87.62% | 420 | 4.2% |
[ 92.0% - 92.5% ] 92.37% | 498 | 10.4% |
[ 93.0% - 93.5% ] 93.24% | 148 | 6.7% |
[ 99.0% - 99.5% ] 99.00% | 201 | 5.7% |