Somali College, 1 year or more

COMPARE

Somali
Race
Ancestry
AfghanAfricanAlaska NativeAlaskan AthabascanAlbanianAleutAlsatianAmericanApacheArabArapahoArgentineanArmenianAssyrian/Chaldean/SyriacAustralianAustrianBahamianBangladeshiBarbadianBasqueBelgianBelizeanBermudanBhutaneseBlackfeetBolivianBrazilianBritishBritish West IndianBulgarianBurmeseCajunCambodianCanadianCape VerdeanCarpatho RusynCelticCentral AmericanCentral American IndianCherokeeCheyenneChickasawChileanChineseChippewaChoctawColombianColvilleComancheCosta RicanCreeCreekCroatianCrowCubanCypriotCzechCzechoslovakianDanishDelawareDominicanDutchDutch West IndianEastern EuropeanEcuadorianEgyptianEnglishEstonianEthiopianEuropeanFijianFilipinoFinnishFrenchFrench American IndianFrench CanadianGermanGerman RussianGhanaianGreekGuamanian/ChamorroGuatemalanGuyaneseHaitianHmongHonduranHopiHoumaHungarianIcelanderIndian (Asian)IndonesianInupiatIranianIraqiIrishIroquoisIsraeliItalianJamaicanJapaneseJordanianKenyanKiowaKoreanLaotianLatvianLebaneseLiberianLithuanianLumbeeLuxembourgerMacedonianMalaysianMalteseMarshalleseMenomineeMexicanMexican American IndianMongolianMoroccanNative HawaiianNavajoNepaleseNew ZealanderNicaraguanNigerianNorthern EuropeanNorwegianOkinawanOsageOttawaPaiutePakistaniPalestinianPanamanianParaguayanPennsylvania GermanPeruvianPimaPolishPortuguesePotawatomiPuebloPuerto RicanPuget Sound SalishRomanianRussianSalvadoranSamoanScandinavianScotch-IrishScottishSeminoleSenegaleseSerbianShoshoneSierra LeoneanSiouxSlavicSlovakSloveneSomaliSouth AfricanSouth AmericanSouth American IndianSoviet UnionSpaniardSpanishSpanish AmericanSpanish American IndianSri LankanSubsaharan AfricanSudaneseSwedishSwissSyrianTaiwaneseThaiTlingit-HaidaTohono O'OdhamTonganTrinidadian and TobagonianTsimshianTurkishU.S. Virgin IslanderUgandanUkrainianUruguayanUteVenezuelanVietnameseWelshWest IndianYakamaYaquiYugoslavianYumanYup'ikZimbabwean
Immigration
NonimmigrantsImmigrantsAfghanistanAfricaAlbaniaArgentinaArmeniaAsiaAustraliaAustriaBahamasBangladeshBarbadosBelarusBelgiumBelizeBoliviaBosnia and HerzegovinaBrazilBulgariaBurma/MyanmarCabo VerdeCambodiaCameroonCanadaCaribbeanCentral AmericaChileChinaColombiaCongoCosta RicaCroatiaCubaCzechoslovakiaDenmarkDominicaDominican RepublicEastern AfricaEastern AsiaEastern EuropeEcuadorEgyptEl SalvadorEnglandEritreaEthiopiaEuropeFijiFranceGermanyGhanaGreeceGrenadaGuatemalaGuyanaHaitiHondurasHong KongHungaryIndiaIndonesiaIranIraqIrelandIsraelItalyJamaicaJapanJordanKazakhstanKenyaKoreaKuwaitLaosLatin AmericaLatviaLebanonLiberiaLithuaniaMalaysiaMexicoMicronesiaMiddle AfricaMoldovaMoroccoNepalNetherlandsNicaraguaNigeriaNorth AmericaNorth MacedoniaNorthern AfricaNorthern EuropeNorwayOceaniaPakistanPanamaPeruPhilippinesPolandPortugalRomaniaRussiaSaudi ArabiaScotlandSenegalSerbiaSierra LeoneSingaporeSomaliaSouth AfricaSouth AmericaSouth Central AsiaSouth Eastern AsiaSouthern EuropeSpainSri LankaSt. Vincent and the GrenadinesSudanSwedenSwitzerlandSyriaTaiwanThailandTrinidad and TobagoTurkeyUgandaUkraineUruguayUzbekistanVenezuelaVietnamWest IndiesWestern AfricaWestern AsiaWestern EuropeYemenZaireZimbabweAzores
Select to Compare
Race
Ancestry
AfghanAfricanAlaska NativeAlaskan AthabascanAlbanianAleutAlsatianAmericanApacheArabArapahoArgentineanArmenianAssyrian/Chaldean/SyriacAustralianAustrianBahamianBangladeshiBarbadianBasqueBelgianBelizeanBermudanBhutaneseBlackfeetBolivianBrazilianBritishBritish West IndianBulgarianBurmeseCajunCambodianCanadianCape VerdeanCarpatho RusynCelticCentral AmericanCentral American IndianCherokeeCheyenneChickasawChileanChineseChippewaChoctawColombianColvilleComancheCosta RicanCreeCreekCroatianCrowCubanCypriotCzechCzechoslovakianDanishDelawareDominicanDutchDutch West IndianEastern EuropeanEcuadorianEgyptianEnglishEstonianEthiopianEuropeanFijianFilipinoFinnishFrenchFrench American IndianFrench CanadianGermanGerman RussianGhanaianGreekGuamanian/ChamorroGuatemalanGuyaneseHaitianHmongHonduranHopiHoumaHungarianIcelanderIndian (Asian)IndonesianInupiatIranianIraqiIrishIroquoisIsraeliItalianJamaicanJapaneseJordanianKenyanKiowaKoreanLaotianLatvianLebaneseLiberianLithuanianLumbeeLuxembourgerMacedonianMalaysianMalteseMarshalleseMenomineeMexicanMexican American IndianMongolianMoroccanNative HawaiianNavajoNepaleseNew ZealanderNicaraguanNigerianNorthern EuropeanNorwegianOkinawanOsageOttawaPaiutePakistaniPalestinianPanamanianParaguayanPennsylvania GermanPeruvianPimaPolishPortuguesePotawatomiPuebloPuerto RicanPuget Sound SalishRomanianRussianSalvadoranSamoanScandinavianScotch-IrishScottishSeminoleSenegaleseSerbianShoshoneSierra LeoneanSiouxSlavicSlovakSloveneSouth AfricanSouth AmericanSouth American IndianSoviet UnionSpaniardSpanishSpanish AmericanSpanish American IndianSri LankanSubsaharan AfricanSudaneseSwedishSwissSyrianTaiwaneseThaiTlingit-HaidaTohono O'OdhamTonganTrinidadian and TobagonianTsimshianTurkishU.S. Virgin IslanderUgandanUkrainianUruguayanUteVenezuelanVietnameseWelshWest IndianYakamaYaquiYugoslavianYumanYup'ikZimbabwean
Immigration
NonimmigrantsImmigrantsAfghanistanAfricaAlbaniaArgentinaArmeniaAsiaAustraliaAustriaBahamasBangladeshBarbadosBelarusBelgiumBelizeBoliviaBosnia and HerzegovinaBrazilBulgariaBurma/MyanmarCabo VerdeCambodiaCameroonCanadaCaribbeanCentral AmericaChileChinaColombiaCongoCosta RicaCroatiaCubaCzechoslovakiaDenmarkDominicaDominican RepublicEastern AfricaEastern AsiaEastern EuropeEcuadorEgyptEl SalvadorEnglandEritreaEthiopiaEuropeFijiFranceGermanyGhanaGreeceGrenadaGuatemalaGuyanaHaitiHondurasHong KongHungaryIndiaIndonesiaIranIraqIrelandIsraelItalyJamaicaJapanJordanKazakhstanKenyaKoreaKuwaitLaosLatin AmericaLatviaLebanonLiberiaLithuaniaMalaysiaMexicoMicronesiaMiddle AfricaMoldovaMoroccoNepalNetherlandsNicaraguaNigeriaNorth AmericaNorth MacedoniaNorthern AfricaNorthern EuropeNorwayOceaniaPakistanPanamaPeruPhilippinesPolandPortugalRomaniaRussiaSaudi ArabiaScotlandSenegalSerbiaSierra LeoneSingaporeSomaliaSouth AfricaSouth AmericaSouth Central AsiaSouth Eastern AsiaSouthern EuropeSpainSri LankaSt. Vincent and the GrenadinesSudanSwedenSwitzerlandSyriaTaiwanThailandTrinidad and TobagoTurkeyUgandaUkraineUruguayUzbekistanVenezuelaVietnamWest IndiesWestern AfricaWestern AsiaWestern EuropeYemenZaireZimbabweAzores
College, 1 year or more
Income
Poverty
Unemployment
Labor Participation
Family Structure
Vehicle Availability
Education Level
Disability

Somali College, 1 year or more
Good

59.9%
COLLEGE, 1 YEAR OR MORE
64.5/ 100
METRIC RATING
161st/ 347
METRIC RANK

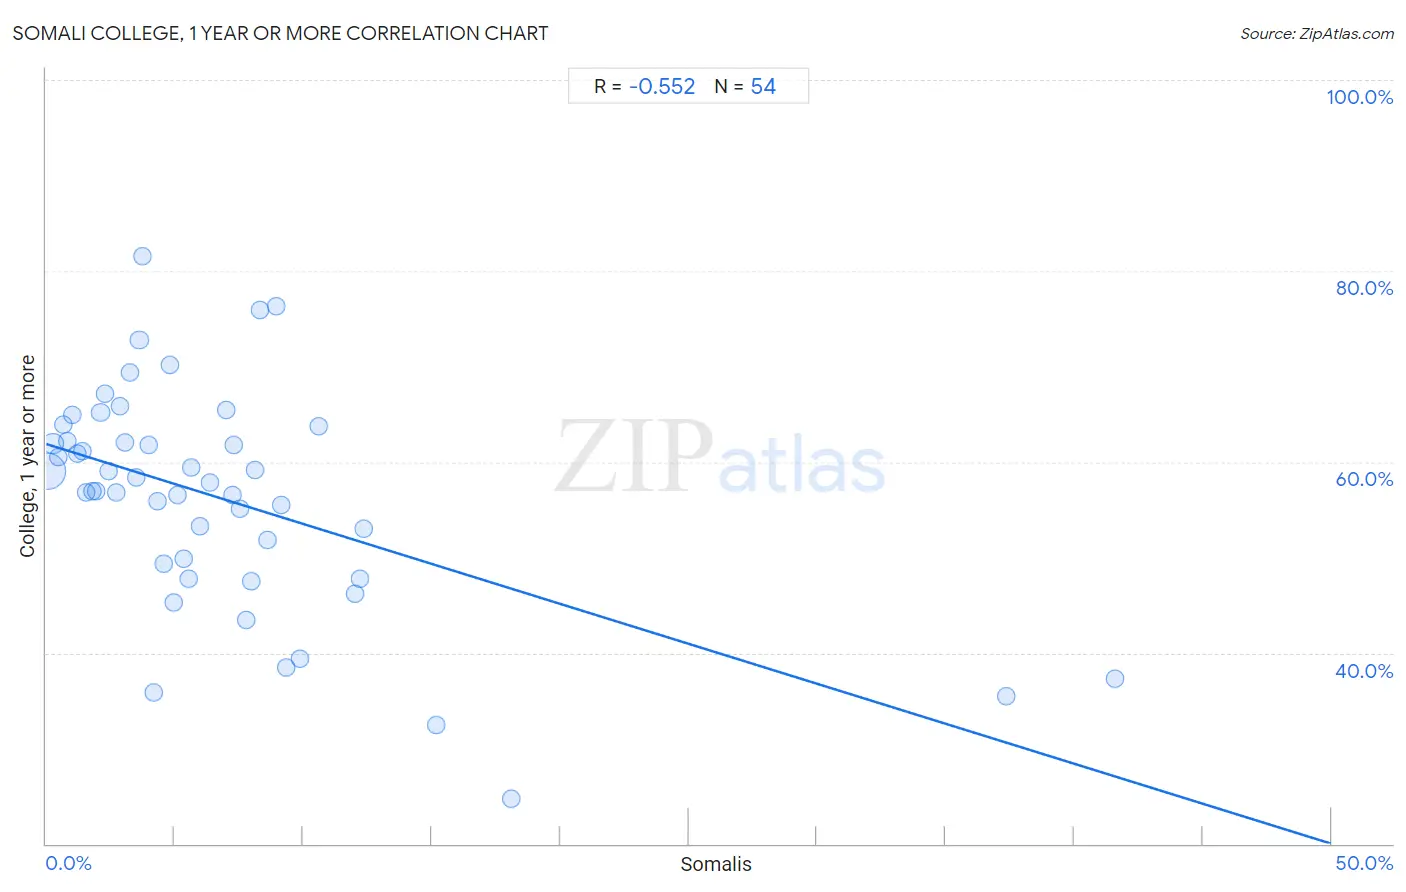
Somali College, 1 year or more Correlation Chart

The statistical analysis conducted on geographies consisting of 99,332,457 people shows a substantial negative correlation between the proportion of Somalis and percentage of population with at least college, 1 year or more education in the United States with a correlation coefficient (R) of -0.552 and weighted average of 59.9%. On average, for every 1% (one percent) increase in Somalis within a typical geography, there is a decrease of 0.84% in percentage of population with at least college, 1 year or more education.
Somali College, 1 year or more
It is essential to understand that the correlation between the percentage of Somalis and percentage of population with at least college, 1 year or more education does not imply a direct cause-and-effect relationship. It remains uncertain whether the presence of Somalis influences an upward or downward trend in the level of percentage of population with at least college, 1 year or more education within an area, or if Somalis simply ended up residing in those areas with higher or lower levels of percentage of population with at least college, 1 year or more education due to other factors.

Demographics Similar to Somalis by College, 1 year or more

In terms of college, 1 year or more, the demographic groups most similar to Somalis are South American Indian (60.0%, a difference of 0.14%), English (60.0%, a difference of 0.15%), Immigrants from Iraq (60.0%, a difference of 0.15%), Immigrants from Armenia (60.0%, a difference of 0.25%), and Korean (59.7%, a difference of 0.34%).
DemographicsRating | RankCollege, 1 year or more
Sudanese
73.0
/100
|
#154
Good
60.2%
Moroccans
72.9
/100
|
#155
Good
60.2%
Finns
72.9
/100
|
#156
Good
60.2%
Immigrants from Armenia
68.8
/100
|
#157
Good
60.0%
English
67.2
/100
|
#158
Good
60.0%
Immigrants from Iraq
67.0
/100
|
#159
Good
60.0%
South American Indians
66.9
/100
|
#160
Good
60.0%
Somalis
64.5
/100
|
#161
Good
59.9%
Koreans
58.5
/100
|
#162
Average
59.7%
Immigrants from Somalia
58.3
/100
|
#163
Average
59.7%
Belgians
58.1
/100
|
#164
Average
59.7%
Irish
56.1
/100
|
#165
Average
59.6%
Immigrants from Africa
56.1
/100
|
#166
Average
59.6%
Immigrants from North Macedonia
53.1
/100
|
#167
Average
59.5%
Hungarians
52.9
/100
|
#168
Average
59.5%

Somali College, 1 year or more Correlation Summary

MeasurementSomali DataCollege, 1 year or more Data
Minimum0.041%24.7%
Maximum41.6%81.5%
Range41.5%56.8%
Mean6.8%56.2%
Median5.0%57.4%
Interquartile 25% (IQ1)2.4%49.3%
Interquartile 75% (IQ3)8.3%62.1%
Interquartile Range (IQR)5.9%12.9%
Standard Deviation (Sample)7.6%11.5%
Standard Deviation (Population)7.5%11.4%

Correlation Details

Somali PercentileSample SizeCollege, 1 year or more
[
0.0%
-
0.5%
]
0.041%
72,717,14559.0%
[
0.0%
-
0.5%
]
0.26%
10,931,37361.9%
[
0.0%
-
0.5%
]
0.47%
3,180,93060.5%
[
0.5%
-
1.0%
]
0.66%
3,143,85663.9%
[
0.5%
-
1.0%
]
0.82%
1,266,20062.1%
[
1.0%
-
1.5%
]
1.04%
1,007,76864.9%
[
1.0%
-
1.5%
]
1.20%
1,112,00860.9%
[
1.0%
-
1.5%
]
1.40%
449,70061.1%
[
1.5%
-
2.0%
]
1.57%
659,25556.8%
[
1.5%
-
2.0%
]
1.78%
187,01356.9%
[
1.5%
-
2.0%
]
1.95%
580,42156.9%
[
2.0%
-
2.5%
]
2.11%
250,86965.2%
[
2.0%
-
2.5%
]
2.28%
145,78467.2%
[
2.0%
-
2.5%
]
2.44%
970,27559.0%
[
2.5%
-
3.0%
]
2.72%
220,12956.8%
[
2.5%
-
3.0%
]
2.86%
236,66165.8%
[
3.0%
-
3.5%
]
3.06%
186,81262.1%
[
3.0%
-
3.5%
]
3.24%
143,51269.4%
[
3.5%
-
4.0%
]
3.51%
172,84058.4%
[
3.5%
-
4.0%
]
3.62%
104,91672.8%
[
3.5%
-
4.0%
]
3.74%
17,64181.5%
[
3.5%
-
4.0%
]
3.99%
205,65861.8%
[
4.0%
-
4.5%
]
4.17%
3,54835.9%
[
4.0%
-
4.5%
]
4.33%
54,02855.8%
[
4.5%
-
5.0%
]
4.58%
21,56949.3%
[
4.5%
-
5.0%
]
4.80%
510,55670.2%
[
4.5%
-
5.0%
]
4.95%
122,96545.3%
[
5.0%
-
5.5%
]
5.11%
17,53256.5%
[
5.0%
-
5.5%
]
5.36%
30,64149.9%
[
5.5%
-
6.0%
]
5.57%
88,76847.7%
[
5.5%
-
6.0%
]
5.65%
17759.4%
[
5.5%
-
6.0%
]
5.97%
23,43353.3%
[
6.0%
-
6.5%
]
6.37%
68,91057.9%
[
7.0%
-
7.5%
]
7.01%
67,99965.4%
[
7.0%
-
7.5%
]
7.23%
42,58156.5%
[
7.0%
-
7.5%
]
7.31%
26,76061.8%
[
7.5%
-
8.0%
]
7.53%
32,68155.1%
[
7.5%
-
8.0%
]
7.77%
30,97343.5%
[
7.5%
-
8.0%
]
7.98%
61,42347.4%
[
8.0%
-
8.5%
]
8.11%
14,74659.2%
[
8.0%
-
8.5%
]
8.30%
24,06775.9%
[
8.5%
-
9.0%
]
8.63%
22,82751.9%
[
8.5%
-
9.0%
]
8.95%
14,75976.4%
[
9.0%
-
9.5%
]
9.13%
23,11055.5%
[
9.0%
-
9.5%
]
9.36%
5,98438.4%
[
9.5%
-
10.0%
]
9.85%
24,41839.4%
[
10.5%
-
11.0%
]
10.62%
63163.7%
[
12.0%
-
12.5%
]
12.03%
32,13646.2%
[
12.0%
-
12.5%
]
12.22%
30,62547.8%
[
12.0%
-
12.5%
]
12.34%
28,17253.1%
[
15.0%
-
15.5%
]
15.16%
3,69332.5%
[
18.0%
-
18.5%
]
18.08%
1,93024.7%
[
37.0%
-
37.5%
]
37.34%
1,15735.4%
[
41.5%
-
42.0%
]
41.59%
8,89237.3%