Somali Receiving Food Stamps
COMPARE
Somali
Select to Compare
Receiving Food Stamps
Somali Receiving Food Stamps
13.7%
PUBLIC INCOME | FOOD STAMPS
0.9/ 100
METRIC RATING
243rd/ 347
METRIC RANK
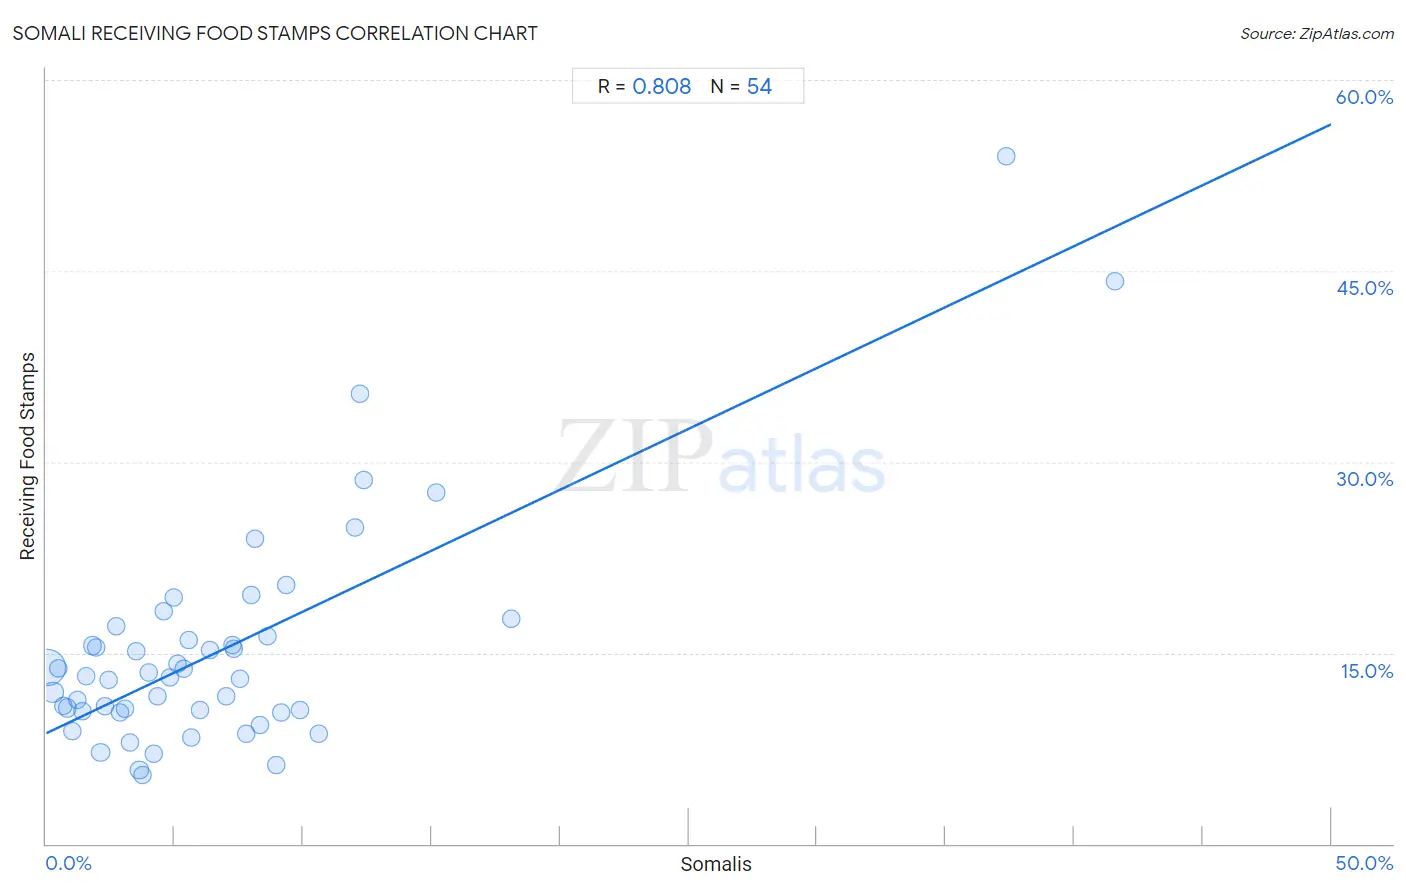
Somali Receiving Food Stamps Correlation Chart
The statistical analysis conducted on geographies consisting of 99,256,962 people shows a very strong positive correlation between the proportion of Somalis and percentage of population receiving government assistance and/or food stamps in the United States with a correlation coefficient (R) of 0.808 and weighted average of 13.7%. On average, for every 1% (one percent) increase in Somalis within a typical geography, there is an increase of 0.96% in percentage of population receiving government assistance and/or food stamps.
It is essential to understand that the correlation between the percentage of Somalis and percentage of population receiving government assistance and/or food stamps does not imply a direct cause-and-effect relationship. It remains uncertain whether the presence of Somalis influences an upward or downward trend in the level of percentage of population receiving government assistance and/or food stamps within an area, or if Somalis simply ended up residing in those areas with higher or lower levels of percentage of population receiving government assistance and/or food stamps due to other factors.
Demographics Similar to Somalis by Receiving Food Stamps
In terms of receiving food stamps, the demographic groups most similar to Somalis are Cajun (13.7%, a difference of 0.16%), Immigrants from Panama (13.6%, a difference of 0.19%), Immigrants from Somalia (13.7%, a difference of 0.20%), Choctaw (13.6%, a difference of 0.38%), and Cree (13.7%, a difference of 0.44%).
| Demographics | Rating | Rank | Receiving Food Stamps |
| Crow | 1.6 /100 | #236 | Tragic 13.4% |
| Immigrants from El Salvador | 1.5 /100 | #237 | Tragic 13.5% |
| French American Indians | 1.4 /100 | #238 | Tragic 13.5% |
| Immigrants from Micronesia | 1.3 /100 | #239 | Tragic 13.5% |
| Iroquois | 1.2 /100 | #240 | Tragic 13.5% |
| Choctaw | 1.0 /100 | #241 | Tragic 13.6% |
| Immigrants from Panama | 1.0 /100 | #242 | Tragic 13.6% |
| Somalis | 0.9 /100 | #243 | Tragic 13.7% |
| Cajuns | 0.9 /100 | #244 | Tragic 13.7% |
| Immigrants from Somalia | 0.9 /100 | #245 | Tragic 13.7% |
| Cree | 0.8 /100 | #246 | Tragic 13.7% |
| Mexican American Indians | 0.7 /100 | #247 | Tragic 13.8% |
| Immigrants from Laos | 0.7 /100 | #248 | Tragic 13.8% |
| Indonesians | 0.6 /100 | #249 | Tragic 13.9% |
| Immigrants from Cambodia | 0.5 /100 | #250 | Tragic 13.9% |
Somali Receiving Food Stamps Correlation Summary
| Measurement | Somali Data | Receiving Food Stamps Data |
| Minimum | 0.041% | 5.4% |
| Maximum | 41.6% | 54.0% |
| Range | 41.5% | 48.6% |
| Mean | 6.8% | 15.2% |
| Median | 5.0% | 13.1% |
| Interquartile 25% (IQ1) | 2.4% | 10.4% |
| Interquartile 75% (IQ3) | 8.3% | 16.3% |
| Interquartile Range (IQR) | 5.9% | 5.9% |
| Standard Deviation (Sample) | 7.6% | 9.0% |
| Standard Deviation (Population) | 7.5% | 8.9% |
Correlation Details
| Somali Percentile | Sample Size | Receiving Food Stamps |
[ 0.0% - 0.5% ] 0.041% | 72,683,331 | 13.8% |
[ 0.0% - 0.5% ] 0.26% | 10,918,541 | 11.9% |
[ 0.0% - 0.5% ] 0.47% | 3,161,309 | 13.8% |
[ 0.5% - 1.0% ] 0.66% | 3,139,136 | 10.8% |
[ 0.5% - 1.0% ] 0.82% | 1,264,222 | 10.7% |
[ 1.0% - 1.5% ] 1.04% | 1,007,768 | 8.8% |
[ 1.0% - 1.5% ] 1.20% | 1,109,989 | 11.3% |
[ 1.0% - 1.5% ] 1.40% | 449,700 | 10.4% |
[ 1.5% - 2.0% ] 1.57% | 659,255 | 13.2% |
[ 1.5% - 2.0% ] 1.78% | 187,013 | 15.6% |
[ 1.5% - 2.0% ] 1.95% | 580,421 | 15.4% |
[ 2.0% - 2.5% ] 2.11% | 250,869 | 7.2% |
[ 2.0% - 2.5% ] 2.28% | 145,273 | 10.8% |
[ 2.0% - 2.5% ] 2.44% | 970,275 | 12.9% |
[ 2.5% - 3.0% ] 2.72% | 220,129 | 17.1% |
[ 2.5% - 3.0% ] 2.86% | 236,661 | 10.3% |
[ 3.0% - 3.5% ] 3.06% | 186,812 | 10.6% |
[ 3.0% - 3.5% ] 3.24% | 143,512 | 7.9% |
[ 3.5% - 4.0% ] 3.51% | 172,840 | 15.1% |
[ 3.5% - 4.0% ] 3.62% | 104,916 | 5.8% |
[ 3.5% - 4.0% ] 3.74% | 17,641 | 5.4% |
[ 3.5% - 4.0% ] 3.99% | 205,658 | 13.5% |
[ 4.0% - 4.5% ] 4.17% | 3,548 | 7.1% |
[ 4.0% - 4.5% ] 4.33% | 54,028 | 11.6% |
[ 4.5% - 5.0% ] 4.58% | 21,569 | 18.3% |
[ 4.5% - 5.0% ] 4.80% | 510,556 | 13.1% |
[ 4.5% - 5.0% ] 4.95% | 122,965 | 19.4% |
[ 5.0% - 5.5% ] 5.11% | 17,532 | 14.2% |
[ 5.0% - 5.5% ] 5.36% | 30,641 | 13.8% |
[ 5.5% - 6.0% ] 5.57% | 88,768 | 16.0% |
[ 5.5% - 6.0% ] 5.65% | 177 | 8.3% |
[ 5.5% - 6.0% ] 5.97% | 23,433 | 10.5% |
[ 6.0% - 6.5% ] 6.37% | 68,910 | 15.2% |
[ 7.0% - 7.5% ] 7.01% | 67,999 | 11.6% |
[ 7.0% - 7.5% ] 7.23% | 42,581 | 15.6% |
[ 7.0% - 7.5% ] 7.31% | 26,760 | 15.3% |
[ 7.5% - 8.0% ] 7.53% | 32,681 | 13.0% |
[ 7.5% - 8.0% ] 7.77% | 30,973 | 8.6% |
[ 7.5% - 8.0% ] 7.98% | 61,423 | 19.6% |
[ 8.0% - 8.5% ] 8.11% | 14,746 | 23.9% |
[ 8.0% - 8.5% ] 8.30% | 24,067 | 9.4% |
[ 8.5% - 9.0% ] 8.63% | 22,827 | 16.3% |
[ 8.5% - 9.0% ] 8.95% | 14,759 | 6.2% |
[ 9.0% - 9.5% ] 9.13% | 23,110 | 10.3% |
[ 9.0% - 9.5% ] 9.36% | 5,984 | 20.3% |
[ 9.5% - 10.0% ] 9.85% | 24,418 | 10.5% |
[ 10.5% - 11.0% ] 10.62% | 631 | 8.6% |
[ 12.0% - 12.5% ] 12.03% | 32,136 | 24.8% |
[ 12.0% - 12.5% ] 12.22% | 30,625 | 35.4% |
[ 12.0% - 12.5% ] 12.34% | 28,172 | 28.6% |
[ 15.0% - 15.5% ] 15.16% | 3,693 | 27.6% |
[ 18.0% - 18.5% ] 18.08% | 1,930 | 17.7% |
[ 37.0% - 37.5% ] 37.34% | 1,157 | 54.0% |
[ 41.5% - 42.0% ] 41.59% | 8,892 | 44.2% |