Somali Married-Couple Family Poverty

COMPARE

Somali
Race
Ancestry
AfghanAfricanAlaska NativeAlaskan AthabascanAlbanianAleutAlsatianAmericanApacheArabArapahoArgentineanArmenianAssyrian/Chaldean/SyriacAustralianAustrianBahamianBangladeshiBarbadianBasqueBelgianBelizeanBermudanBhutaneseBlackfeetBolivianBrazilianBritishBritish West IndianBulgarianBurmeseCajunCambodianCanadianCape VerdeanCarpatho RusynCelticCentral AmericanCentral American IndianCherokeeCheyenneChickasawChileanChineseChippewaChoctawColombianColvilleComancheCosta RicanCreeCreekCroatianCrowCubanCypriotCzechCzechoslovakianDanishDelawareDominicanDutchDutch West IndianEastern EuropeanEcuadorianEgyptianEnglishEstonianEthiopianEuropeanFijianFilipinoFinnishFrenchFrench American IndianFrench CanadianGermanGerman RussianGhanaianGreekGuamanian/ChamorroGuatemalanGuyaneseHaitianHmongHonduranHopiHoumaHungarianIcelanderIndian (Asian)IndonesianInupiatIranianIraqiIrishIroquoisIsraeliItalianJamaicanJapaneseJordanianKenyanKiowaKoreanLaotianLatvianLebaneseLiberianLithuanianLumbeeLuxembourgerMacedonianMalaysianMalteseMarshalleseMenomineeMexicanMexican American IndianMongolianMoroccanNative HawaiianNavajoNepaleseNew ZealanderNicaraguanNigerianNorthern EuropeanNorwegianOkinawanOsageOttawaPaiutePakistaniPalestinianPanamanianParaguayanPennsylvania GermanPeruvianPimaPolishPortuguesePotawatomiPuebloPuerto RicanPuget Sound SalishRomanianRussianSalvadoranSamoanScandinavianScotch-IrishScottishSeminoleSenegaleseSerbianShoshoneSierra LeoneanSiouxSlavicSlovakSloveneSomaliSouth AfricanSouth AmericanSouth American IndianSoviet UnionSpaniardSpanishSpanish AmericanSpanish American IndianSri LankanSubsaharan AfricanSudaneseSwedishSwissSyrianTaiwaneseThaiTlingit-HaidaTohono O'OdhamTonganTrinidadian and TobagonianTsimshianTurkishU.S. Virgin IslanderUgandanUkrainianUruguayanUteVenezuelanVietnameseWelshWest IndianYakamaYaquiYugoslavianYumanYup'ikZimbabwean
Immigration
NonimmigrantsImmigrantsAfghanistanAfricaAlbaniaArgentinaArmeniaAsiaAustraliaAustriaBahamasBangladeshBarbadosBelarusBelgiumBelizeBoliviaBosnia and HerzegovinaBrazilBulgariaBurma/MyanmarCabo VerdeCambodiaCameroonCanadaCaribbeanCentral AmericaChileChinaColombiaCongoCosta RicaCroatiaCubaCzechoslovakiaDenmarkDominicaDominican RepublicEastern AfricaEastern AsiaEastern EuropeEcuadorEgyptEl SalvadorEnglandEritreaEthiopiaEuropeFijiFranceGermanyGhanaGreeceGrenadaGuatemalaGuyanaHaitiHondurasHong KongHungaryIndiaIndonesiaIranIraqIrelandIsraelItalyJamaicaJapanJordanKazakhstanKenyaKoreaKuwaitLaosLatin AmericaLatviaLebanonLiberiaLithuaniaMalaysiaMexicoMicronesiaMiddle AfricaMoldovaMoroccoNepalNetherlandsNicaraguaNigeriaNorth AmericaNorth MacedoniaNorthern AfricaNorthern EuropeNorwayOceaniaPakistanPanamaPeruPhilippinesPolandPortugalRomaniaRussiaSaudi ArabiaScotlandSenegalSerbiaSierra LeoneSingaporeSomaliaSouth AfricaSouth AmericaSouth Central AsiaSouth Eastern AsiaSouthern EuropeSpainSri LankaSt. Vincent and the GrenadinesSudanSwedenSwitzerlandSyriaTaiwanThailandTrinidad and TobagoTurkeyUgandaUkraineUruguayUzbekistanVenezuelaVietnamWest IndiesWestern AfricaWestern AsiaWestern EuropeYemenZaireZimbabweAzores
Select to Compare
Race
Ancestry
AfghanAfricanAlaska NativeAlaskan AthabascanAlbanianAleutAlsatianAmericanApacheArabArapahoArgentineanArmenianAssyrian/Chaldean/SyriacAustralianAustrianBahamianBangladeshiBarbadianBasqueBelgianBelizeanBermudanBhutaneseBlackfeetBolivianBrazilianBritishBritish West IndianBulgarianBurmeseCajunCambodianCanadianCape VerdeanCarpatho RusynCelticCentral AmericanCentral American IndianCherokeeCheyenneChickasawChileanChineseChippewaChoctawColombianColvilleComancheCosta RicanCreeCreekCroatianCrowCubanCypriotCzechCzechoslovakianDanishDelawareDominicanDutchDutch West IndianEastern EuropeanEcuadorianEgyptianEnglishEstonianEthiopianEuropeanFijianFilipinoFinnishFrenchFrench American IndianFrench CanadianGermanGerman RussianGhanaianGreekGuamanian/ChamorroGuatemalanGuyaneseHaitianHmongHonduranHopiHoumaHungarianIcelanderIndian (Asian)IndonesianInupiatIranianIraqiIrishIroquoisIsraeliItalianJamaicanJapaneseJordanianKenyanKiowaKoreanLaotianLatvianLebaneseLiberianLithuanianLumbeeLuxembourgerMacedonianMalaysianMalteseMarshalleseMenomineeMexicanMexican American IndianMongolianMoroccanNative HawaiianNavajoNepaleseNew ZealanderNicaraguanNigerianNorthern EuropeanNorwegianOkinawanOsageOttawaPaiutePakistaniPalestinianPanamanianParaguayanPennsylvania GermanPeruvianPimaPolishPortuguesePotawatomiPuebloPuerto RicanPuget Sound SalishRomanianRussianSalvadoranSamoanScandinavianScotch-IrishScottishSeminoleSenegaleseSerbianShoshoneSierra LeoneanSiouxSlavicSlovakSloveneSouth AfricanSouth AmericanSouth American IndianSoviet UnionSpaniardSpanishSpanish AmericanSpanish American IndianSri LankanSubsaharan AfricanSudaneseSwedishSwissSyrianTaiwaneseThaiTlingit-HaidaTohono O'OdhamTonganTrinidadian and TobagonianTsimshianTurkishU.S. Virgin IslanderUgandanUkrainianUruguayanUteVenezuelanVietnameseWelshWest IndianYakamaYaquiYugoslavianYumanYup'ikZimbabwean
Immigration
NonimmigrantsImmigrantsAfghanistanAfricaAlbaniaArgentinaArmeniaAsiaAustraliaAustriaBahamasBangladeshBarbadosBelarusBelgiumBelizeBoliviaBosnia and HerzegovinaBrazilBulgariaBurma/MyanmarCabo VerdeCambodiaCameroonCanadaCaribbeanCentral AmericaChileChinaColombiaCongoCosta RicaCroatiaCubaCzechoslovakiaDenmarkDominicaDominican RepublicEastern AfricaEastern AsiaEastern EuropeEcuadorEgyptEl SalvadorEnglandEritreaEthiopiaEuropeFijiFranceGermanyGhanaGreeceGrenadaGuatemalaGuyanaHaitiHondurasHong KongHungaryIndiaIndonesiaIranIraqIrelandIsraelItalyJamaicaJapanJordanKazakhstanKenyaKoreaKuwaitLaosLatin AmericaLatviaLebanonLiberiaLithuaniaMalaysiaMexicoMicronesiaMiddle AfricaMoldovaMoroccoNepalNetherlandsNicaraguaNigeriaNorth AmericaNorth MacedoniaNorthern AfricaNorthern EuropeNorwayOceaniaPakistanPanamaPeruPhilippinesPolandPortugalRomaniaRussiaSaudi ArabiaScotlandSenegalSerbiaSierra LeoneSingaporeSomaliaSouth AfricaSouth AmericaSouth Central AsiaSouth Eastern AsiaSouthern EuropeSpainSri LankaSt. Vincent and the GrenadinesSudanSwedenSwitzerlandSyriaTaiwanThailandTrinidad and TobagoTurkeyUgandaUkraineUruguayUzbekistanVenezuelaVietnamWest IndiesWestern AfricaWestern AsiaWestern EuropeYemenZaireZimbabweAzores
Married-Couple Family Poverty
Income
Poverty
Unemployment
Labor Participation
Family Structure
Vehicle Availability
Education Level
Disability

Somali Married-Couple Family Poverty
Tragic

5.8%
POVERTY | MARRIED-COUPLE FAMILIES
2.3/ 100
METRIC RATING
243rd/ 347
METRIC RANK

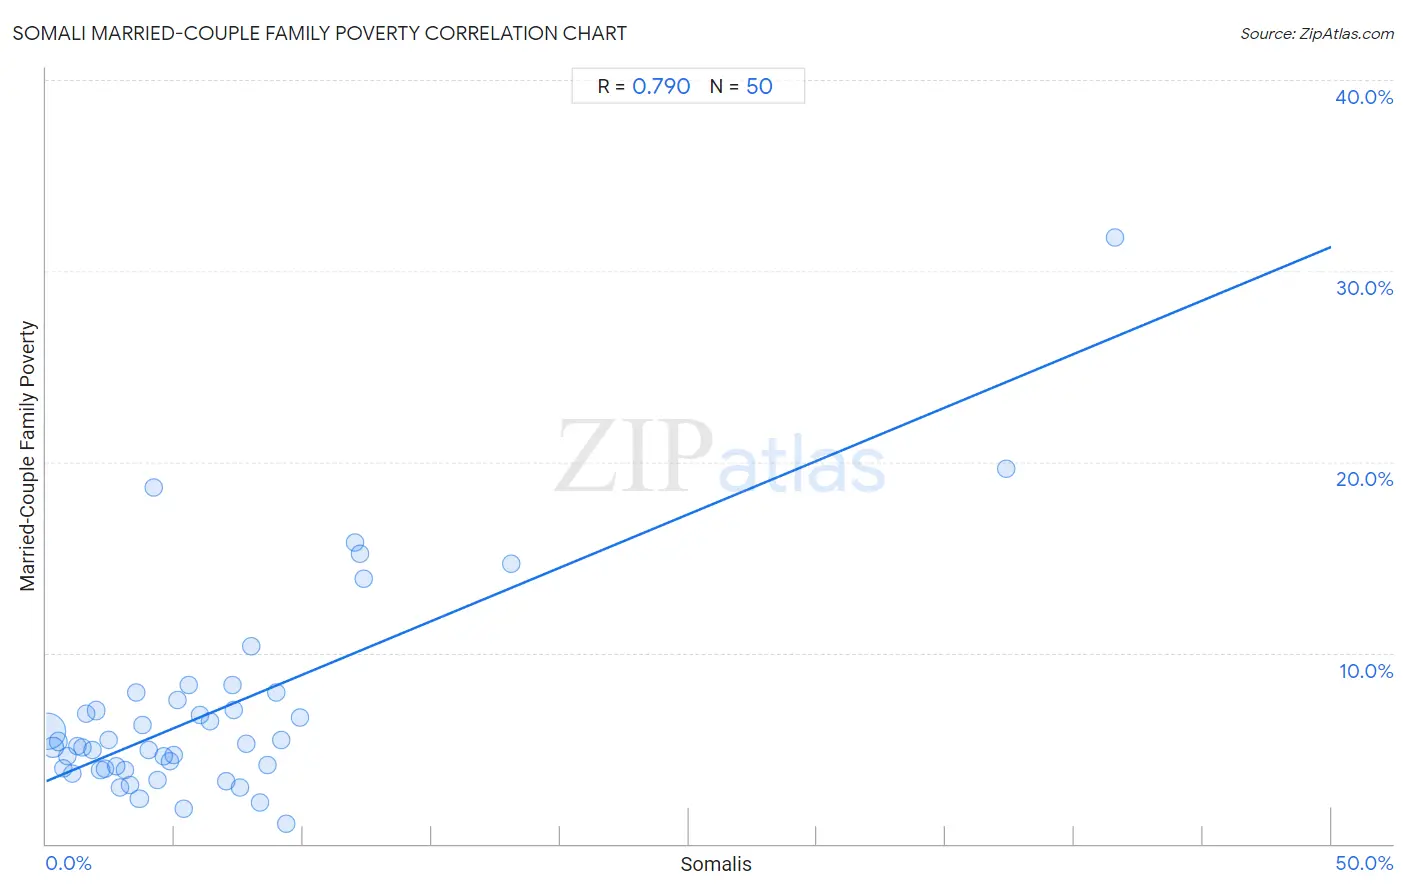
Somali Married-Couple Family Poverty Correlation Chart

The statistical analysis conducted on geographies consisting of 99,100,573 people shows a strong positive correlation between the proportion of Somalis and poverty level among married-couple families in the United States with a correlation coefficient (R) of 0.790 and weighted average of 5.8%. On average, for every 1% (one percent) increase in Somalis within a typical geography, there is an increase of 0.56% in poverty level among married-couple families.
Somali Married-Couple Family Poverty
It is essential to understand that the correlation between the percentage of Somalis and poverty level among married-couple families does not imply a direct cause-and-effect relationship. It remains uncertain whether the presence of Somalis influences an upward or downward trend in the level of poverty level among married-couple families within an area, or if Somalis simply ended up residing in those areas with higher or lower levels of poverty level among married-couple families due to other factors.

Demographics Similar to Somalis by Married-Couple Family Poverty

In terms of married-couple family poverty, the demographic groups most similar to Somalis are Chickasaw (5.8%, a difference of 0.010%), Immigrants from Western Africa (5.8%, a difference of 0.16%), Immigrants from Afghanistan (5.8%, a difference of 0.16%), Immigrants from Panama (5.8%, a difference of 0.24%), and Fijian (5.8%, a difference of 0.27%).
DemographicsRating | RankMarried-Couple Family Poverty
Ghanaians
3.3
/100
|
#236
Tragic
5.7%
Immigrants from South America
3.1
/100
|
#237
Tragic
5.7%
Cherokee
2.7
/100
|
#238
Tragic
5.8%
Venezuelans
2.7
/100
|
#239
Tragic
5.8%
Fijians
2.5
/100
|
#240
Tragic
5.8%
Immigrants from Panama
2.5
/100
|
#241
Tragic
5.8%
Immigrants from Western Africa
2.4
/100
|
#242
Tragic
5.8%
Somalis
2.3
/100
|
#243
Tragic
5.8%
Chickasaw
2.3
/100
|
#244
Tragic
5.8%
Immigrants from Afghanistan
2.1
/100
|
#245
Tragic
5.8%
Immigrants from Venezuela
1.8
/100
|
#246
Tragic
5.8%
Iraqis
1.4
/100
|
#247
Tragic
5.9%
Cree
1.2
/100
|
#248
Tragic
5.9%
Tsimshian
1.1
/100
|
#249
Tragic
5.9%
Immigrants from Eritrea
1.1
/100
|
#250
Tragic
5.9%

Somali Married-Couple Family Poverty Correlation Summary

MeasurementSomali DataMarried-Couple Family Poverty Data
Minimum0.041%1.1%
Maximum41.6%31.7%
Range41.5%30.7%
Mean6.6%7.0%
Median4.7%5.2%
Interquartile 25% (IQ1)2.3%3.9%
Interquartile 75% (IQ3)8.0%7.5%
Interquartile Range (IQR)5.7%3.6%
Standard Deviation (Sample)7.8%5.5%
Standard Deviation (Population)7.7%5.4%

Correlation Details

Somali PercentileSample SizeMarried-Couple Family Poverty
[
0.0%
-
0.5%
]
0.041%
72,635,5055.9%
[
0.0%
-
0.5%
]
0.26%
10,873,7395.0%
[
0.0%
-
0.5%
]
0.47%
3,139,9945.3%
[
0.5%
-
1.0%
]
0.66%
3,134,6594.0%
[
0.5%
-
1.0%
]
0.82%
1,263,1564.6%
[
1.0%
-
1.5%
]
1.04%
1,007,7683.7%
[
1.0%
-
1.5%
]
1.20%
1,097,9735.1%
[
1.0%
-
1.5%
]
1.40%
449,3995.1%
[
1.5%
-
2.0%
]
1.57%
659,2556.8%
[
1.5%
-
2.0%
]
1.78%
186,0124.9%
[
1.5%
-
2.0%
]
1.95%
580,4217.0%
[
2.0%
-
2.5%
]
2.11%
250,0173.9%
[
2.0%
-
2.5%
]
2.28%
145,2733.9%
[
2.0%
-
2.5%
]
2.44%
970,2755.5%
[
2.5%
-
3.0%
]
2.72%
219,7614.1%
[
2.5%
-
3.0%
]
2.86%
236,6612.9%
[
3.0%
-
3.5%
]
3.06%
186,8123.8%
[
3.0%
-
3.5%
]
3.24%
143,5123.1%
[
3.5%
-
4.0%
]
3.51%
172,8407.9%
[
3.5%
-
4.0%
]
3.62%
104,9162.3%
[
3.5%
-
4.0%
]
3.74%
17,6416.2%
[
3.5%
-
4.0%
]
3.99%
205,6584.9%
[
4.0%
-
4.5%
]
4.17%
3,54818.7%
[
4.0%
-
4.5%
]
4.33%
54,0283.3%
[
4.5%
-
5.0%
]
4.58%
21,5694.6%
[
4.5%
-
5.0%
]
4.80%
510,5564.3%
[
4.5%
-
5.0%
]
4.95%
122,9654.6%
[
5.0%
-
5.5%
]
5.11%
17,5327.5%
[
5.0%
-
5.5%
]
5.36%
27,5231.8%
[
5.5%
-
6.0%
]
5.57%
88,7688.3%
[
5.5%
-
6.0%
]
5.97%
23,4336.7%
[
6.0%
-
6.5%
]
6.37%
68,9106.4%
[
7.0%
-
7.5%
]
7.01%
67,9993.3%
[
7.0%
-
7.5%
]
7.23%
42,5818.3%
[
7.0%
-
7.5%
]
7.31%
26,7607.0%
[
7.5%
-
8.0%
]
7.53%
32,6812.9%
[
7.5%
-
8.0%
]
7.77%
30,9735.3%
[
7.5%
-
8.0%
]
7.98%
61,42310.3%
[
8.0%
-
8.5%
]
8.30%
24,0672.2%
[
8.5%
-
9.0%
]
8.63%
22,8274.1%
[
8.5%
-
9.0%
]
8.95%
14,7597.9%
[
9.0%
-
9.5%
]
9.13%
23,1105.4%
[
9.0%
-
9.5%
]
9.36%
5,9841.1%
[
9.5%
-
10.0%
]
9.85%
24,4186.6%
[
12.0%
-
12.5%
]
12.03%
32,13615.8%
[
12.0%
-
12.5%
]
12.22%
30,62515.2%
[
12.0%
-
12.5%
]
12.34%
28,17213.9%
[
18.0%
-
18.5%
]
18.08%
1,93014.7%
[
37.0%
-
37.5%
]
37.34%
1,15719.6%
[
41.5%
-
42.0%
]
41.59%
8,89231.7%