Somali Unemployment Among Women with Children Ages 6 to 17 years
COMPARE
Somali
Select to Compare
Unemployment Among Women with Children Ages 6 to 17 years
Somali Unemployment Among Women with Children Ages 6 to 17 years
8.0%
UNEMPLOYMENT | WOMEN W/ CHILDREN 6 TO 17
100.0/ 100
METRIC RATING
39th/ 347
METRIC RANK
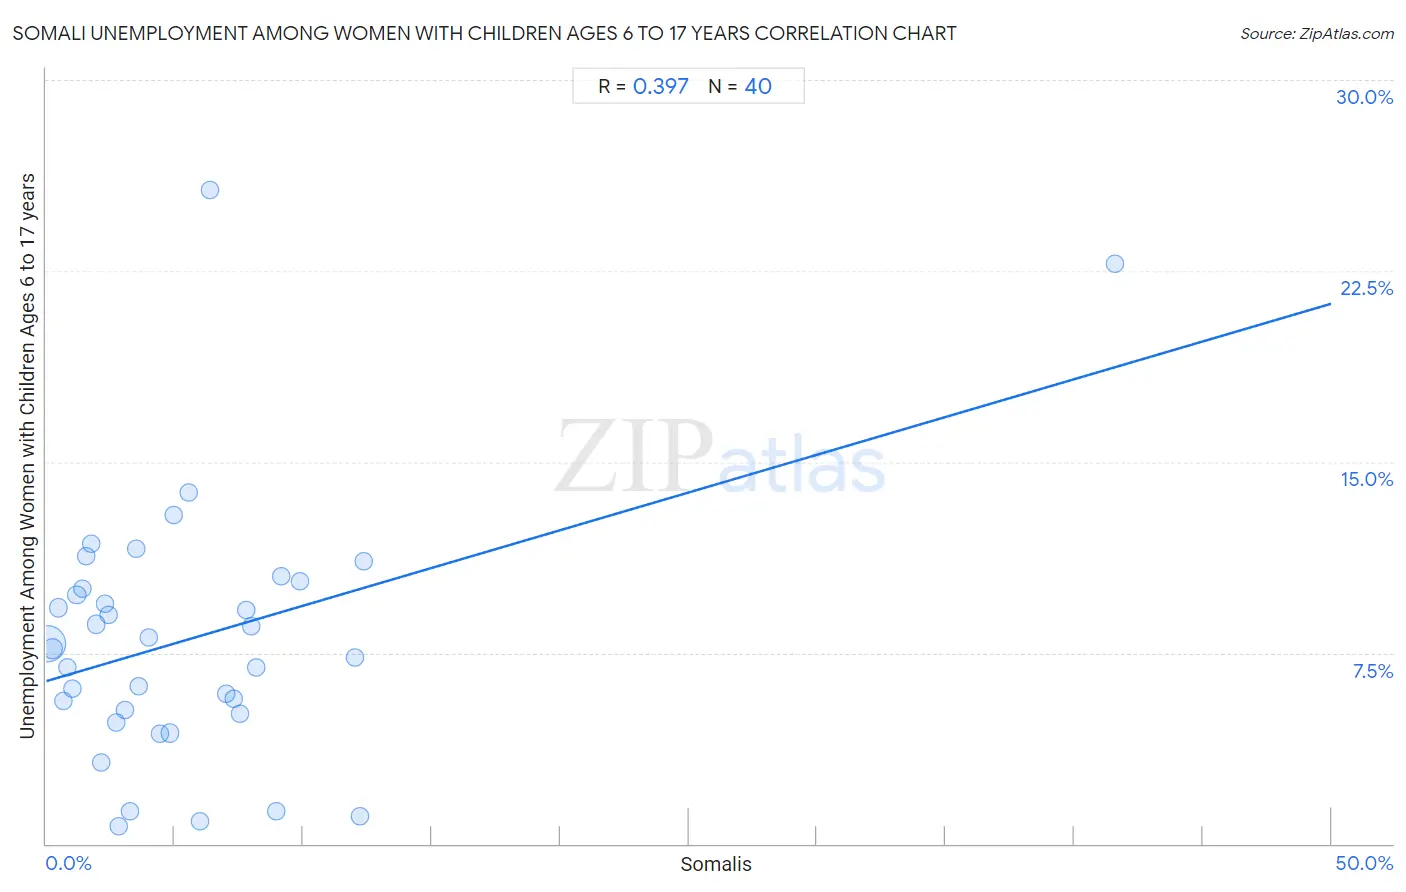
Somali Unemployment Among Women with Children Ages 6 to 17 years Correlation Chart
The statistical analysis conducted on geographies consisting of 87,159,329 people shows a mild positive correlation between the proportion of Somalis and unemployment rate among women with children between the ages 6 and 17 in the United States with a correlation coefficient (R) of 0.397 and weighted average of 8.0%. On average, for every 1% (one percent) increase in Somalis within a typical geography, there is an increase of 0.30% in unemployment rate among women with children between the ages 6 and 17.
It is essential to understand that the correlation between the percentage of Somalis and unemployment rate among women with children between the ages 6 and 17 does not imply a direct cause-and-effect relationship. It remains uncertain whether the presence of Somalis influences an upward or downward trend in the level of unemployment rate among women with children between the ages 6 and 17 within an area, or if Somalis simply ended up residing in those areas with higher or lower levels of unemployment rate among women with children between the ages 6 and 17 due to other factors.
Demographics Similar to Somalis by Unemployment Among Women with Children Ages 6 to 17 years
In terms of unemployment among women with children ages 6 to 17 years, the demographic groups most similar to Somalis are Alsatian (8.0%, a difference of 0.14%), Immigrants from Zimbabwe (8.0%, a difference of 0.29%), Iranian (8.0%, a difference of 0.36%), Asian (8.0%, a difference of 0.47%), and Burmese (8.0%, a difference of 0.51%).
| Demographics | Rating | Rank | Unemployment Among Women with Children Ages 6 to 17 years |
| Immigrants from Cambodia | 100.0 /100 | #32 | Exceptional 7.9% |
| Immigrants from Korea | 100.0 /100 | #33 | Exceptional 7.9% |
| Native Hawaiians | 100.0 /100 | #34 | Exceptional 7.9% |
| Immigrants from South Central Asia | 100.0 /100 | #35 | Exceptional 7.9% |
| Burmese | 100.0 /100 | #36 | Exceptional 8.0% |
| Asians | 100.0 /100 | #37 | Exceptional 8.0% |
| Alsatians | 100.0 /100 | #38 | Exceptional 8.0% |
| Somalis | 100.0 /100 | #39 | Exceptional 8.0% |
| Immigrants from Zimbabwe | 100.0 /100 | #40 | Exceptional 8.0% |
| Iranians | 100.0 /100 | #41 | Exceptional 8.0% |
| Immigrants from Somalia | 100.0 /100 | #42 | Exceptional 8.0% |
| Bhutanese | 100.0 /100 | #43 | Exceptional 8.1% |
| Immigrants from Sweden | 100.0 /100 | #44 | Exceptional 8.1% |
| Immigrants from Bulgaria | 100.0 /100 | #45 | Exceptional 8.1% |
| Icelanders | 100.0 /100 | #46 | Exceptional 8.1% |
Somali Unemployment Among Women with Children Ages 6 to 17 years Correlation Summary
| Measurement | Somali Data | Unemployment Among Women with Children Ages 6 to 17 years Data |
| Minimum | 0.039% | 0.70% |
| Maximum | 41.6% | 25.7% |
| Range | 41.5% | 25.0% |
| Mean | 5.6% | 8.1% |
| Median | 3.8% | 7.8% |
| Interquartile 25% (IQ1) | 1.9% | 5.2% |
| Interquartile 75% (IQ3) | 7.6% | 10.2% |
| Interquartile Range (IQR) | 5.8% | 5.0% |
| Standard Deviation (Sample) | 6.8% | 5.1% |
| Standard Deviation (Population) | 6.7% | 5.0% |
Correlation Details
| Somali Percentile | Sample Size | Unemployment Among Women with Children Ages 6 to 17 years |
[ 0.0% - 0.5% ] 0.039% | 66,287,808 | 7.9% |
[ 0.0% - 0.5% ] 0.26% | 9,006,475 | 7.7% |
[ 0.0% - 0.5% ] 0.47% | 2,524,444 | 9.3% |
[ 0.5% - 1.0% ] 0.66% | 2,277,939 | 5.6% |
[ 0.5% - 1.0% ] 0.82% | 940,295 | 6.9% |
[ 1.0% - 1.5% ] 1.03% | 641,511 | 6.1% |
[ 1.0% - 1.5% ] 1.19% | 719,137 | 9.8% |
[ 1.0% - 1.5% ] 1.40% | 363,759 | 10.0% |
[ 1.5% - 2.0% ] 1.57% | 520,629 | 11.3% |
[ 1.5% - 2.0% ] 1.76% | 124,879 | 11.8% |
[ 1.5% - 2.0% ] 1.95% | 461,337 | 8.6% |
[ 2.0% - 2.5% ] 2.12% | 229,165 | 3.2% |
[ 2.0% - 2.5% ] 2.27% | 131,197 | 9.4% |
[ 2.0% - 2.5% ] 2.44% | 941,575 | 9.0% |
[ 2.5% - 3.0% ] 2.71% | 173,967 | 4.8% |
[ 2.5% - 3.0% ] 2.83% | 120,848 | 0.70% |
[ 3.0% - 3.5% ] 3.06% | 113,345 | 5.3% |
[ 3.0% - 3.5% ] 3.24% | 131,520 | 1.3% |
[ 3.5% - 4.0% ] 3.51% | 123,655 | 11.6% |
[ 3.5% - 4.0% ] 3.59% | 64,458 | 6.2% |
[ 3.5% - 4.0% ] 3.98% | 139,494 | 8.1% |
[ 4.0% - 4.5% ] 4.45% | 8,923 | 4.3% |
[ 4.5% - 5.0% ] 4.80% | 478,244 | 4.3% |
[ 4.5% - 5.0% ] 4.96% | 75,154 | 12.9% |
[ 5.5% - 6.0% ] 5.57% | 78,412 | 13.8% |
[ 5.5% - 6.0% ] 5.97% | 23,433 | 0.90% |
[ 6.0% - 6.5% ] 6.37% | 68,910 | 25.7% |
[ 7.0% - 7.5% ] 7.01% | 67,999 | 5.9% |
[ 7.0% - 7.5% ] 7.31% | 26,760 | 5.7% |
[ 7.5% - 8.0% ] 7.53% | 30,787 | 5.1% |
[ 7.5% - 8.0% ] 7.77% | 30,973 | 9.2% |
[ 7.5% - 8.0% ] 7.98% | 61,423 | 8.5% |
[ 8.0% - 8.5% ] 8.16% | 8,762 | 6.9% |
[ 8.5% - 9.0% ] 8.95% | 14,759 | 1.3% |
[ 9.0% - 9.5% ] 9.13% | 23,110 | 10.5% |
[ 9.5% - 10.0% ] 9.85% | 24,418 | 10.3% |
[ 12.0% - 12.5% ] 12.03% | 32,136 | 7.3% |
[ 12.0% - 12.5% ] 12.22% | 30,625 | 1.1% |
[ 12.0% - 12.5% ] 12.34% | 28,172 | 11.1% |
[ 41.5% - 42.0% ] 41.59% | 8,892 | 22.8% |