Marshallese 1 or more Vehicles in Household
COMPARE
Marshallese
Select to Compare
1 or more Vehicles in Household
Marshallese 1 or more Vehicles in Household
90.4%
1+ VEHICLES AVAILABLE
88.9/ 100
METRIC RATING
129th/ 347
METRIC RANK
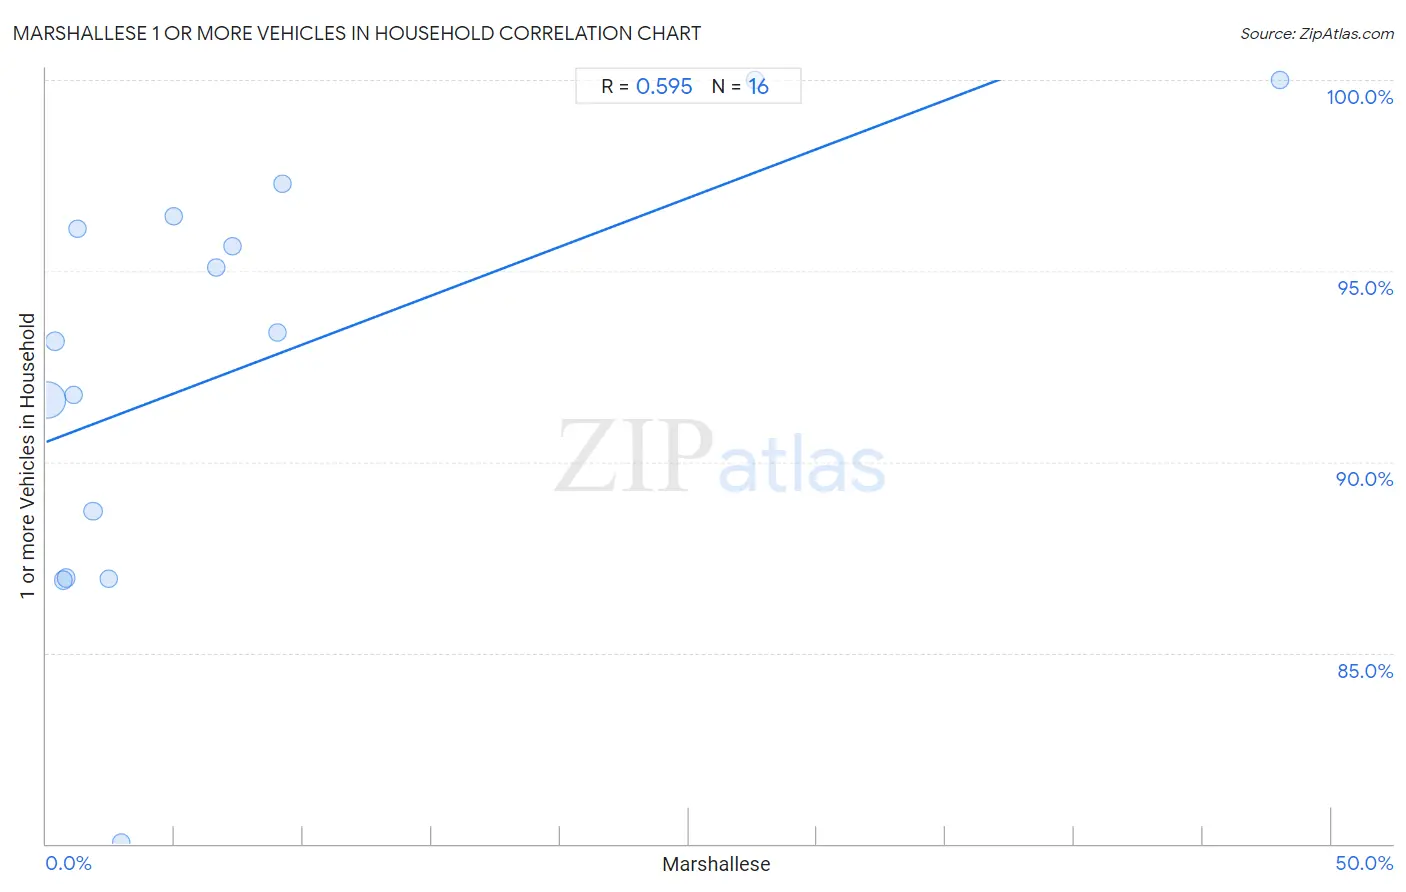
Marshallese 1 or more Vehicles in Household Correlation Chart
The statistical analysis conducted on geographies consisting of 14,761,315 people shows a substantial positive correlation between the proportion of Marshallese and percentage of households with 1 or more vehicles available in the United States with a correlation coefficient (R) of 0.595 and weighted average of 90.4%. On average, for every 1% (one percent) increase in Marshallese within a typical geography, there is an increase of 0.26% in percentage of households with 1 or more vehicles available.
It is essential to understand that the correlation between the percentage of Marshallese and percentage of households with 1 or more vehicles available does not imply a direct cause-and-effect relationship. It remains uncertain whether the presence of Marshallese influences an upward or downward trend in the level of percentage of households with 1 or more vehicles available within an area, or if Marshallese simply ended up residing in those areas with higher or lower levels of percentage of households with 1 or more vehicles available due to other factors.
Demographics Similar to Marshallese by 1 or more Vehicles in Household
In terms of 1 or more vehicles in household, the demographic groups most similar to Marshallese are Nicaraguan (90.4%, a difference of 0.0%), Immigrants from the Azores (90.4%, a difference of 0.010%), Burmese (90.4%, a difference of 0.010%), Immigrants from Cameroon (90.4%, a difference of 0.020%), and Immigrants from Kenya (90.4%, a difference of 0.020%).
| Demographics | Rating | Rank | 1 or more Vehicles in Household |
| Costa Ricans | 92.0 /100 | #122 | Exceptional 90.5% |
| Fijians | 91.8 /100 | #123 | Exceptional 90.5% |
| Puget Sound Salish | 91.5 /100 | #124 | Exceptional 90.5% |
| Immigrants from Korea | 90.5 /100 | #125 | Exceptional 90.5% |
| Immigrants from Cameroon | 89.4 /100 | #126 | Excellent 90.4% |
| Immigrants from the Azores | 89.1 /100 | #127 | Excellent 90.4% |
| Burmese | 89.0 /100 | #128 | Excellent 90.4% |
| Marshallese | 88.9 /100 | #129 | Excellent 90.4% |
| Nicaraguans | 88.8 /100 | #130 | Excellent 90.4% |
| Immigrants from Kenya | 88.5 /100 | #131 | Excellent 90.4% |
| Immigrants from South Africa | 88.1 /100 | #132 | Excellent 90.4% |
| Immigrants from Syria | 87.5 /100 | #133 | Excellent 90.4% |
| Kenyans | 87.0 /100 | #134 | Excellent 90.4% |
| Immigrants from Oceania | 86.9 /100 | #135 | Excellent 90.4% |
| Hungarians | 86.5 /100 | #136 | Excellent 90.3% |
Marshallese 1 or more Vehicles in Household Correlation Summary
| Measurement | Marshallese Data | 1 or more Vehicles in Household Data |
| Minimum | 0.037% | 80.0% |
| Maximum | 48.0% | 100.0% |
| Range | 48.0% | 20.0% |
| Mean | 7.7% | 92.5% |
| Median | 2.7% | 93.3% |
| Interquartile 25% (IQ1) | 0.94% | 87.8% |
| Interquartile 75% (IQ3) | 8.1% | 96.3% |
| Interquartile Range (IQR) | 7.2% | 8.4% |
| Standard Deviation (Sample) | 12.7% | 5.5% |
| Standard Deviation (Population) | 12.3% | 5.3% |
Correlation Details
| Marshallese Percentile | Sample Size | 1 or more Vehicles in Household |
[ 0.0% - 0.5% ] 0.037% | 12,928,307 | 91.6% |
[ 0.0% - 0.5% ] 0.34% | 859,705 | 93.2% |
[ 0.5% - 1.0% ] 0.66% | 591,328 | 86.9% |
[ 0.5% - 1.0% ] 0.79% | 133,430 | 87.0% |
[ 1.0% - 1.5% ] 1.08% | 112,589 | 91.7% |
[ 1.0% - 1.5% ] 1.23% | 2,853 | 96.1% |
[ 1.5% - 2.0% ] 1.82% | 104,259 | 88.7% |
[ 2.0% - 2.5% ] 2.45% | 13,749 | 87.0% |
[ 2.5% - 3.0% ] 2.89% | 2,971 | 80.0% |
[ 4.5% - 5.0% ] 4.94% | 324 | 96.4% |
[ 6.5% - 7.0% ] 6.61% | 4,827 | 95.1% |
[ 7.0% - 7.5% ] 7.25% | 1,932 | 95.7% |
[ 8.5% - 9.0% ] 8.98% | 3,754 | 93.4% |
[ 9.0% - 9.5% ] 9.18% | 196 | 97.3% |
[ 27.5% - 28.0% ] 27.56% | 693 | 100.0% |
[ 47.5% - 48.0% ] 47.99% | 398 | 100.0% |