Marshallese Unemployment Among Women with Children Ages 6 to 17 years
COMPARE
Marshallese
Select to Compare
Unemployment Among Women with Children Ages 6 to 17 years
Marshallese Unemployment Among Women with Children Ages 6 to 17 years
8.3%
UNEMPLOYMENT | WOMEN W/ CHILDREN 6 TO 17
99.9/ 100
METRIC RATING
68th/ 347
METRIC RANK
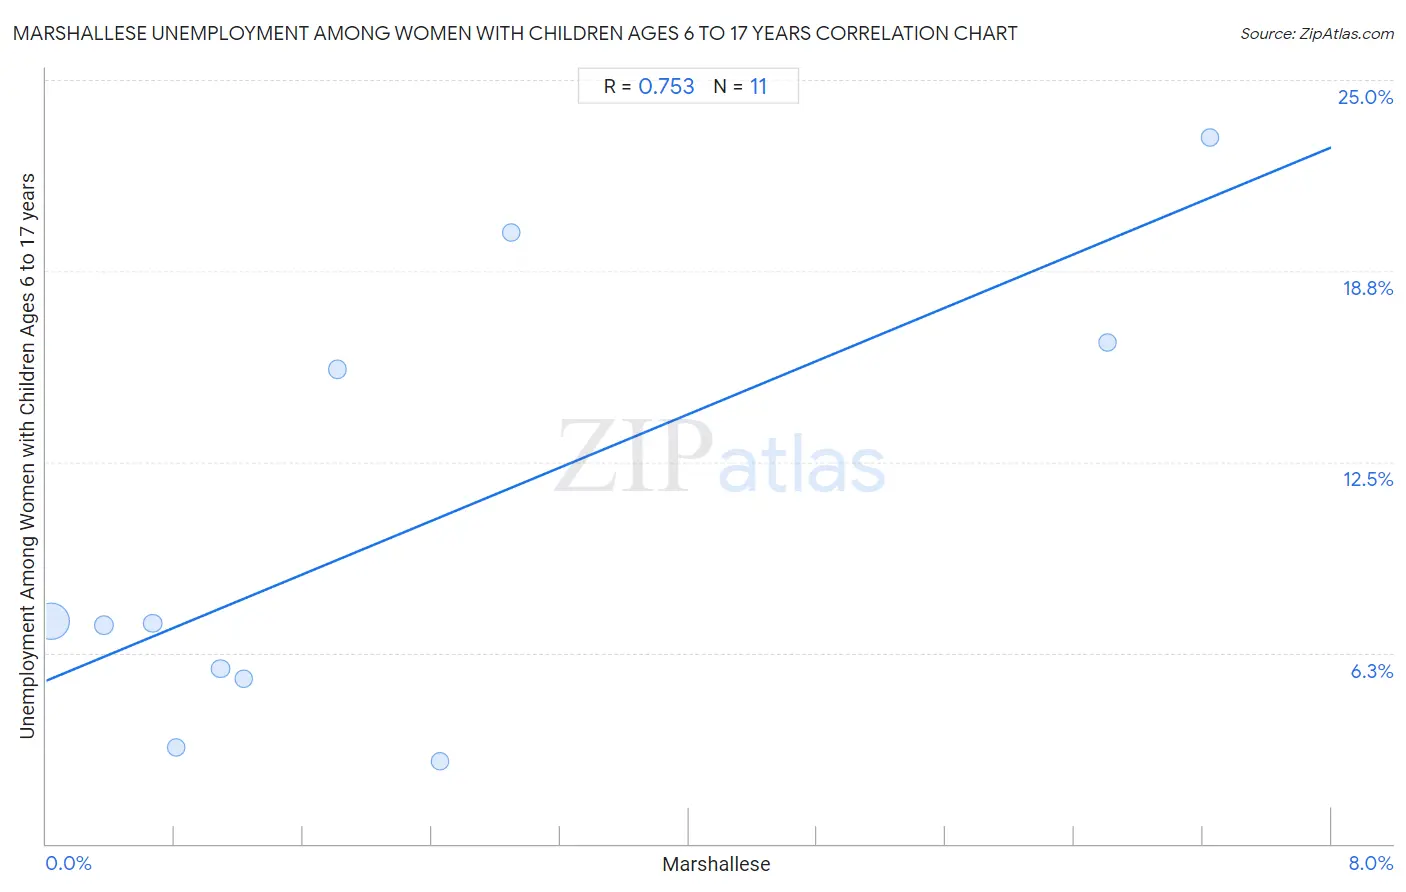
Marshallese Unemployment Among Women with Children Ages 6 to 17 years Correlation Chart
The statistical analysis conducted on geographies consisting of 13,266,761 people shows a strong positive correlation between the proportion of Marshallese and unemployment rate among women with children between the ages 6 and 17 in the United States with a correlation coefficient (R) of 0.753 and weighted average of 8.3%. On average, for every 1% (one percent) increase in Marshallese within a typical geography, there is an increase of 2.2% in unemployment rate among women with children between the ages 6 and 17.
It is essential to understand that the correlation between the percentage of Marshallese and unemployment rate among women with children between the ages 6 and 17 does not imply a direct cause-and-effect relationship. It remains uncertain whether the presence of Marshallese influences an upward or downward trend in the level of unemployment rate among women with children between the ages 6 and 17 within an area, or if Marshallese simply ended up residing in those areas with higher or lower levels of unemployment rate among women with children between the ages 6 and 17 due to other factors.
Demographics Similar to Marshallese by Unemployment Among Women with Children Ages 6 to 17 years
In terms of unemployment among women with children ages 6 to 17 years, the demographic groups most similar to Marshallese are Immigrants from Thailand (8.3%, a difference of 0.030%), Armenian (8.3%, a difference of 0.080%), Norwegian (8.3%, a difference of 0.11%), Luxembourger (8.3%, a difference of 0.18%), and Immigrants from Australia (8.3%, a difference of 0.18%).
| Demographics | Rating | Rank | Unemployment Among Women with Children Ages 6 to 17 years |
| Koreans | 100.0 /100 | #61 | Exceptional 8.2% |
| Spanish American Indians | 100.0 /100 | #62 | Exceptional 8.2% |
| Immigrants from South Eastern Asia | 99.9 /100 | #63 | Exceptional 8.2% |
| Immigrants from Kuwait | 99.9 /100 | #64 | Exceptional 8.3% |
| Immigrants from Albania | 99.9 /100 | #65 | Exceptional 8.3% |
| Luxembourgers | 99.9 /100 | #66 | Exceptional 8.3% |
| Armenians | 99.9 /100 | #67 | Exceptional 8.3% |
| Marshallese | 99.9 /100 | #68 | Exceptional 8.3% |
| Immigrants from Thailand | 99.9 /100 | #69 | Exceptional 8.3% |
| Norwegians | 99.9 /100 | #70 | Exceptional 8.3% |
| Immigrants from Australia | 99.8 /100 | #71 | Exceptional 8.3% |
| Immigrants from Nepal | 99.8 /100 | #72 | Exceptional 8.3% |
| Spanish Americans | 99.8 /100 | #73 | Exceptional 8.4% |
| Samoans | 99.7 /100 | #74 | Exceptional 8.4% |
| Immigrants from Sri Lanka | 99.7 /100 | #75 | Exceptional 8.4% |
Marshallese Unemployment Among Women with Children Ages 6 to 17 years Correlation Summary
| Measurement | Marshallese Data | Unemployment Among Women with Children Ages 6 to 17 years Data |
| Minimum | 0.033% | 2.7% |
| Maximum | 7.2% | 23.1% |
| Range | 7.2% | 20.4% |
| Mean | 2.3% | 10.3% |
| Median | 1.2% | 7.2% |
| Interquartile 25% (IQ1) | 0.66% | 5.4% |
| Interquartile 75% (IQ3) | 2.9% | 16.4% |
| Interquartile Range (IQR) | 2.2% | 11.0% |
| Standard Deviation (Sample) | 2.5% | 7.1% |
| Standard Deviation (Population) | 2.3% | 6.8% |
Correlation Details
| Marshallese Percentile | Sample Size | Unemployment Among Women with Children Ages 6 to 17 years |
[ 0.0% - 0.5% ] 0.033% | 11,826,869 | 7.3% |
[ 0.0% - 0.5% ] 0.36% | 560,903 | 7.1% |
[ 0.5% - 1.0% ] 0.66% | 579,913 | 7.2% |
[ 0.5% - 1.0% ] 0.81% | 81,902 | 3.2% |
[ 1.0% - 1.5% ] 1.08% | 93,476 | 5.7% |
[ 1.0% - 1.5% ] 1.23% | 2,853 | 5.4% |
[ 1.5% - 2.0% ] 1.82% | 97,366 | 15.5% |
[ 2.0% - 2.5% ] 2.45% | 13,749 | 2.7% |
[ 2.5% - 3.0% ] 2.89% | 2,971 | 20.0% |
[ 6.5% - 7.0% ] 6.61% | 4,827 | 16.4% |
[ 7.0% - 7.5% ] 7.25% | 1,932 | 23.1% |