Marshallese Married-couple Households

COMPARE

Marshallese
Race
Ancestry
AfghanAfricanAlaska NativeAlaskan AthabascanAlbanianAleutAlsatianAmericanApacheArabArapahoArgentineanArmenianAssyrian/Chaldean/SyriacAustralianAustrianBahamianBangladeshiBarbadianBasqueBelgianBelizeanBermudanBhutaneseBlackfeetBolivianBrazilianBritishBritish West IndianBulgarianBurmeseCajunCambodianCanadianCape VerdeanCarpatho RusynCelticCentral AmericanCentral American IndianCherokeeCheyenneChickasawChileanChineseChippewaChoctawColombianColvilleComancheCosta RicanCreeCreekCroatianCrowCubanCypriotCzechCzechoslovakianDanishDelawareDominicanDutchDutch West IndianEastern EuropeanEcuadorianEgyptianEnglishEstonianEthiopianEuropeanFijianFilipinoFinnishFrenchFrench American IndianFrench CanadianGermanGerman RussianGhanaianGreekGuamanian/ChamorroGuatemalanGuyaneseHaitianHmongHonduranHopiHoumaHungarianIcelanderIndian (Asian)IndonesianInupiatIranianIraqiIrishIroquoisIsraeliItalianJamaicanJapaneseJordanianKenyanKiowaKoreanLaotianLatvianLebaneseLiberianLithuanianLumbeeLuxembourgerMacedonianMalaysianMalteseMarshalleseMenomineeMexicanMexican American IndianMongolianMoroccanNative HawaiianNavajoNepaleseNew ZealanderNicaraguanNigerianNorthern EuropeanNorwegianOkinawanOsageOttawaPaiutePakistaniPalestinianPanamanianParaguayanPennsylvania GermanPeruvianPimaPolishPortuguesePotawatomiPuebloPuerto RicanPuget Sound SalishRomanianRussianSalvadoranSamoanScandinavianScotch-IrishScottishSeminoleSenegaleseSerbianShoshoneSierra LeoneanSiouxSlavicSlovakSloveneSomaliSouth AfricanSouth AmericanSouth American IndianSoviet UnionSpaniardSpanishSpanish AmericanSpanish American IndianSri LankanSubsaharan AfricanSudaneseSwedishSwissSyrianTaiwaneseThaiTlingit-HaidaTohono O'OdhamTonganTrinidadian and TobagonianTsimshianTurkishU.S. Virgin IslanderUgandanUkrainianUruguayanUteVenezuelanVietnameseWelshWest IndianYakamaYaquiYugoslavianYumanYup'ikZimbabwean
Immigration
NonimmigrantsImmigrantsAfghanistanAfricaAlbaniaArgentinaArmeniaAsiaAustraliaAustriaBahamasBangladeshBarbadosBelarusBelgiumBelizeBoliviaBosnia and HerzegovinaBrazilBulgariaBurma/MyanmarCabo VerdeCambodiaCameroonCanadaCaribbeanCentral AmericaChileChinaColombiaCongoCosta RicaCroatiaCubaCzechoslovakiaDenmarkDominicaDominican RepublicEastern AfricaEastern AsiaEastern EuropeEcuadorEgyptEl SalvadorEnglandEritreaEthiopiaEuropeFijiFranceGermanyGhanaGreeceGrenadaGuatemalaGuyanaHaitiHondurasHong KongHungaryIndiaIndonesiaIranIraqIrelandIsraelItalyJamaicaJapanJordanKazakhstanKenyaKoreaKuwaitLaosLatin AmericaLatviaLebanonLiberiaLithuaniaMalaysiaMexicoMicronesiaMiddle AfricaMoldovaMoroccoNepalNetherlandsNicaraguaNigeriaNorth AmericaNorth MacedoniaNorthern AfricaNorthern EuropeNorwayOceaniaPakistanPanamaPeruPhilippinesPolandPortugalRomaniaRussiaSaudi ArabiaScotlandSenegalSerbiaSierra LeoneSingaporeSomaliaSouth AfricaSouth AmericaSouth Central AsiaSouth Eastern AsiaSouthern EuropeSpainSri LankaSt. Vincent and the GrenadinesSudanSwedenSwitzerlandSyriaTaiwanThailandTrinidad and TobagoTurkeyUgandaUkraineUruguayUzbekistanVenezuelaVietnamWest IndiesWestern AfricaWestern AsiaWestern EuropeYemenZaireZimbabweAzores
Select to Compare
Race
Ancestry
AfghanAfricanAlaska NativeAlaskan AthabascanAlbanianAleutAlsatianAmericanApacheArabArapahoArgentineanArmenianAssyrian/Chaldean/SyriacAustralianAustrianBahamianBangladeshiBarbadianBasqueBelgianBelizeanBermudanBhutaneseBlackfeetBolivianBrazilianBritishBritish West IndianBulgarianBurmeseCajunCambodianCanadianCape VerdeanCarpatho RusynCelticCentral AmericanCentral American IndianCherokeeCheyenneChickasawChileanChineseChippewaChoctawColombianColvilleComancheCosta RicanCreeCreekCroatianCrowCubanCypriotCzechCzechoslovakianDanishDelawareDominicanDutchDutch West IndianEastern EuropeanEcuadorianEgyptianEnglishEstonianEthiopianEuropeanFijianFilipinoFinnishFrenchFrench American IndianFrench CanadianGermanGerman RussianGhanaianGreekGuamanian/ChamorroGuatemalanGuyaneseHaitianHmongHonduranHopiHoumaHungarianIcelanderIndian (Asian)IndonesianInupiatIranianIraqiIrishIroquoisIsraeliItalianJamaicanJapaneseJordanianKenyanKiowaKoreanLaotianLatvianLebaneseLiberianLithuanianLumbeeLuxembourgerMacedonianMalaysianMalteseMenomineeMexicanMexican American IndianMongolianMoroccanNative HawaiianNavajoNepaleseNew ZealanderNicaraguanNigerianNorthern EuropeanNorwegianOkinawanOsageOttawaPaiutePakistaniPalestinianPanamanianParaguayanPennsylvania GermanPeruvianPimaPolishPortuguesePotawatomiPuebloPuerto RicanPuget Sound SalishRomanianRussianSalvadoranSamoanScandinavianScotch-IrishScottishSeminoleSenegaleseSerbianShoshoneSierra LeoneanSiouxSlavicSlovakSloveneSomaliSouth AfricanSouth AmericanSouth American IndianSoviet UnionSpaniardSpanishSpanish AmericanSpanish American IndianSri LankanSubsaharan AfricanSudaneseSwedishSwissSyrianTaiwaneseThaiTlingit-HaidaTohono O'OdhamTonganTrinidadian and TobagonianTsimshianTurkishU.S. Virgin IslanderUgandanUkrainianUruguayanUteVenezuelanVietnameseWelshWest IndianYakamaYaquiYugoslavianYumanYup'ikZimbabwean
Immigration
NonimmigrantsImmigrantsAfghanistanAfricaAlbaniaArgentinaArmeniaAsiaAustraliaAustriaBahamasBangladeshBarbadosBelarusBelgiumBelizeBoliviaBosnia and HerzegovinaBrazilBulgariaBurma/MyanmarCabo VerdeCambodiaCameroonCanadaCaribbeanCentral AmericaChileChinaColombiaCongoCosta RicaCroatiaCubaCzechoslovakiaDenmarkDominicaDominican RepublicEastern AfricaEastern AsiaEastern EuropeEcuadorEgyptEl SalvadorEnglandEritreaEthiopiaEuropeFijiFranceGermanyGhanaGreeceGrenadaGuatemalaGuyanaHaitiHondurasHong KongHungaryIndiaIndonesiaIranIraqIrelandIsraelItalyJamaicaJapanJordanKazakhstanKenyaKoreaKuwaitLaosLatin AmericaLatviaLebanonLiberiaLithuaniaMalaysiaMexicoMicronesiaMiddle AfricaMoldovaMoroccoNepalNetherlandsNicaraguaNigeriaNorth AmericaNorth MacedoniaNorthern AfricaNorthern EuropeNorwayOceaniaPakistanPanamaPeruPhilippinesPolandPortugalRomaniaRussiaSaudi ArabiaScotlandSenegalSerbiaSierra LeoneSingaporeSomaliaSouth AfricaSouth AmericaSouth Central AsiaSouth Eastern AsiaSouthern EuropeSpainSri LankaSt. Vincent and the GrenadinesSudanSwedenSwitzerlandSyriaTaiwanThailandTrinidad and TobagoTurkeyUgandaUkraineUruguayUzbekistanVenezuelaVietnamWest IndiesWestern AfricaWestern AsiaWestern EuropeYemenZaireZimbabweAzores
Married-couple Households
Income
Poverty
Unemployment
Labor Participation
Family Structure
Vehicle Availability
Education Level
Disability

Marshallese Married-couple Households
Tragic

44.6%
MARRIED-COUPLE HOUSEHOLDS
1.5/ 100
METRIC RATING
232nd/ 347
METRIC RANK

Marshallese Married-couple Households Correlation Chart

The statistical analysis conducted on geographies consisting of 14,761,315 people shows a slight positive correlation between the proportion of Marshallese and percentage of married-couple family households in the United States with a correlation coefficient (R) of 0.074 and weighted average of 44.6%. On average, for every 1% (one percent) increase in Marshallese within a typical geography, there is an increase of 0.087% in percentage of married-couple family households.
Marshallese Married-couple Households
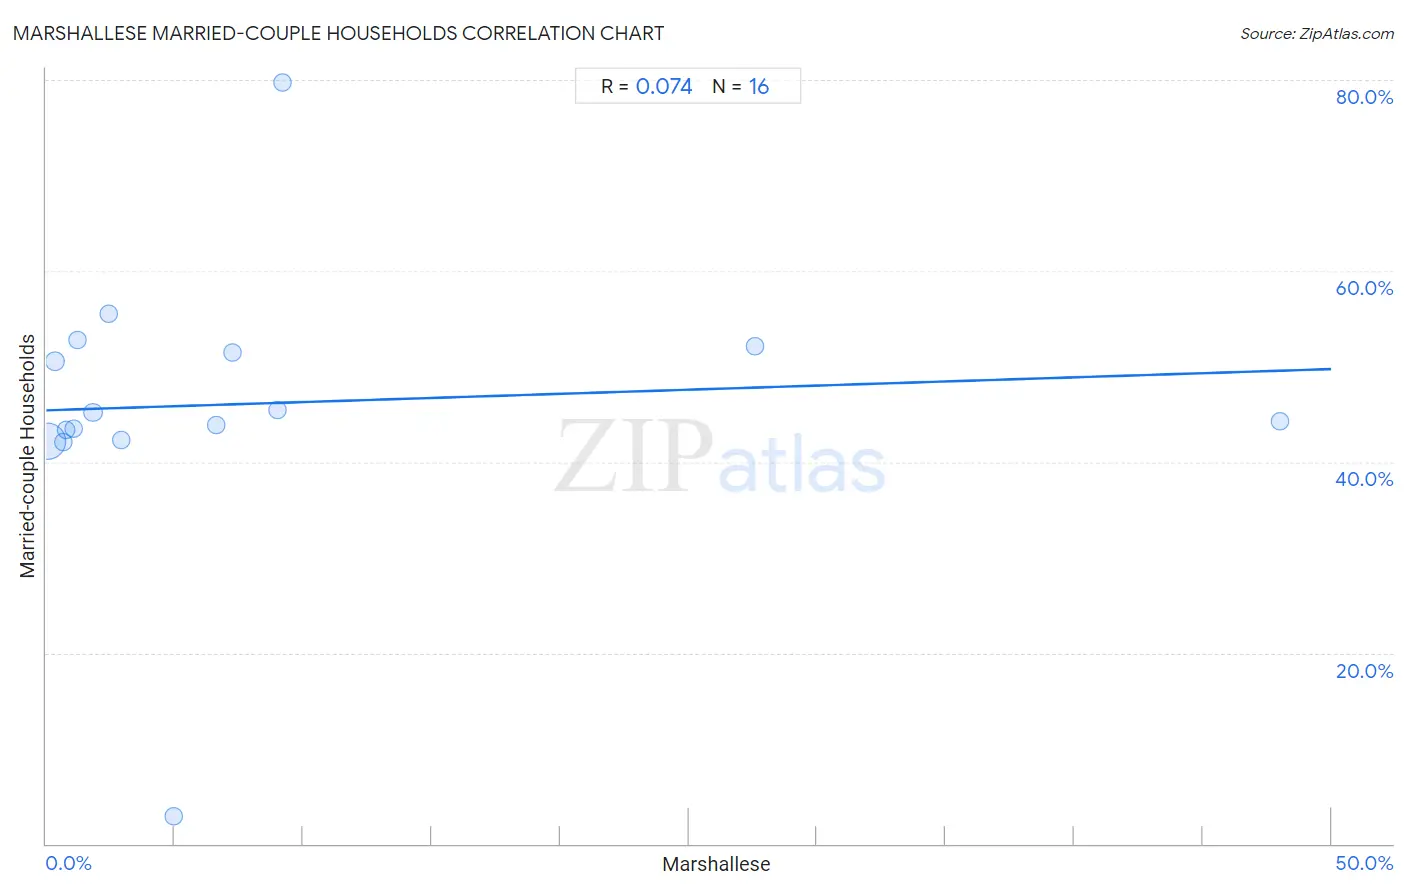
It is essential to understand that the correlation between the percentage of Marshallese and percentage of married-couple family households does not imply a direct cause-and-effect relationship. It remains uncertain whether the presence of Marshallese influences an upward or downward trend in the level of percentage of married-couple family households within an area, or if Marshallese simply ended up residing in those areas with higher or lower levels of percentage of married-couple family households due to other factors.

Demographics Similar to Marshallese by Married-couple Households

In terms of married-couple households, the demographic groups most similar to Marshallese are Houma (44.6%, a difference of 0.0%), Soviet Union (44.6%, a difference of 0.010%), Immigrants from Uganda (44.6%, a difference of 0.040%), Immigrants from Latin America (44.7%, a difference of 0.050%), and Kenyan (44.7%, a difference of 0.10%).
DemographicsRating | RankMarried-couple Households
Dutch West Indians
2.6
/100
|
#225
Tragic
44.9%
Alsatians
2.3
/100
|
#226
Tragic
44.8%
Salvadorans
1.9
/100
|
#227
Tragic
44.7%
Kenyans
1.7
/100
|
#228
Tragic
44.7%
Immigrants from Latin America
1.6
/100
|
#229
Tragic
44.7%
Soviet Union
1.6
/100
|
#230
Tragic
44.6%
Houma
1.5
/100
|
#231
Tragic
44.6%
Marshallese
1.5
/100
|
#232
Tragic
44.6%
Immigrants from Uganda
1.5
/100
|
#233
Tragic
44.6%
Immigrants from Panama
1.3
/100
|
#234
Tragic
44.6%
Immigrants from Nicaragua
1.2
/100
|
#235
Tragic
44.5%
Yaqui
1.2
/100
|
#236
Tragic
44.5%
Comanche
1.2
/100
|
#237
Tragic
44.5%
Immigrants from Uruguay
1.1
/100
|
#238
Tragic
44.5%
Spanish Americans
1.1
/100
|
#239
Tragic
44.5%

Marshallese Married-couple Households Correlation Summary

MeasurementMarshallese DataMarried-couple Households Data
Minimum0.037%2.9%
Maximum48.0%79.7%
Range48.0%76.9%
Mean7.7%46.1%
Median2.7%44.7%
Interquartile 25% (IQ1)0.94%42.8%
Interquartile 75% (IQ3)8.1%51.8%
Interquartile Range (IQR)7.2%9.0%
Standard Deviation (Sample)12.7%14.8%
Standard Deviation (Population)12.3%14.3%

Correlation Details

Marshallese PercentileSample SizeMarried-couple Households
[
0.0%
-
0.5%
]
0.037%
12,928,30742.2%
[
0.0%
-
0.5%
]
0.34%
859,70550.5%
[
0.5%
-
1.0%
]
0.66%
591,32842.1%
[
0.5%
-
1.0%
]
0.79%
133,43043.3%
[
1.0%
-
1.5%
]
1.08%
112,58943.5%
[
1.0%
-
1.5%
]
1.23%
2,85352.7%
[
1.5%
-
2.0%
]
1.82%
104,25945.2%
[
2.0%
-
2.5%
]
2.45%
13,74955.5%
[
2.5%
-
3.0%
]
2.89%
2,97142.3%
[
4.5%
-
5.0%
]
4.94%
3242.9%
[
6.5%
-
7.0%
]
6.61%
4,82743.9%
[
7.0%
-
7.5%
]
7.25%
1,93251.4%
[
8.5%
-
9.0%
]
8.98%
3,75445.5%
[
9.0%
-
9.5%
]
9.18%
19679.7%
[
27.5%
-
28.0%
]
27.56%
69352.2%
[
47.5%
-
48.0%
]
47.99%
39844.3%