Jamaican Male Disability
COMPARE
Jamaican
Select to Compare
Male Disability
Jamaican Male Disability
11.5%
DISABILITY | MALES
10.9/ 100
METRIC RATING
203rd/ 347
METRIC RANK
Jamaican Male Disability Correlation Chart
The statistical analysis conducted on geographies consisting of 367,937,563 people shows a poor negative correlation between the proportion of Jamaicans and percentage of males with a disability in the United States with a correlation coefficient (R) of -0.115 and weighted average of 11.5%. On average, for every 1% (one percent) increase in Jamaicans within a typical geography, there is a decrease of 0.036% in percentage of males with a disability.
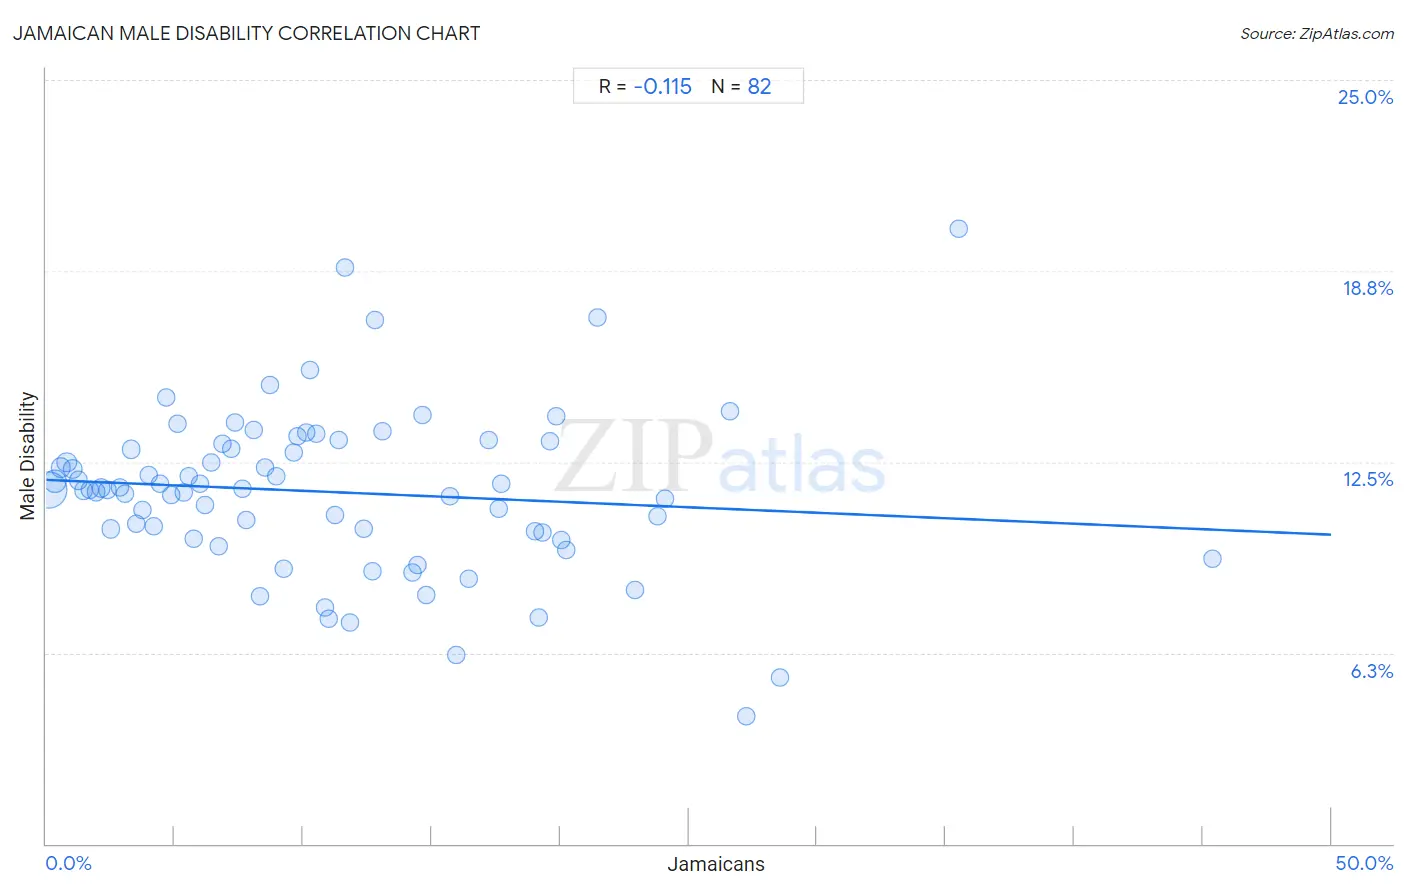
It is essential to understand that the correlation between the percentage of Jamaicans and percentage of males with a disability does not imply a direct cause-and-effect relationship. It remains uncertain whether the presence of Jamaicans influences an upward or downward trend in the level of percentage of males with a disability within an area, or if Jamaicans simply ended up residing in those areas with higher or lower levels of percentage of males with a disability due to other factors.
Demographics Similar to Jamaicans by Male Disability
In terms of male disability, the demographic groups most similar to Jamaicans are Immigrants from Cambodia (11.5%, a difference of 0.010%), Serbian (11.5%, a difference of 0.020%), Ukrainian (11.5%, a difference of 0.030%), Immigrants from Somalia (11.5%, a difference of 0.060%), and Icelander (11.6%, a difference of 0.10%).
| Demographics | Rating | Rank | Male Disability |
| West Indians | 18.4 /100 | #196 | Poor 11.4% |
| Somalis | 18.2 /100 | #197 | Poor 11.4% |
| Immigrants from Jamaica | 16.3 /100 | #198 | Poor 11.5% |
| Lebanese | 15.4 /100 | #199 | Poor 11.5% |
| Immigrants from Iraq | 13.0 /100 | #200 | Poor 11.5% |
| Immigrants from Panama | 13.0 /100 | #201 | Poor 11.5% |
| Immigrants from Mexico | 12.6 /100 | #202 | Poor 11.5% |
| Jamaicans | 10.9 /100 | #203 | Poor 11.5% |
| Immigrants from Cambodia | 10.8 /100 | #204 | Poor 11.5% |
| Serbians | 10.7 /100 | #205 | Poor 11.5% |
| Ukrainians | 10.6 /100 | #206 | Poor 11.5% |
| Immigrants from Somalia | 10.4 /100 | #207 | Poor 11.5% |
| Icelanders | 10.1 /100 | #208 | Poor 11.6% |
| Spanish American Indians | 10.1 /100 | #209 | Poor 11.6% |
| Ute | 9.4 /100 | #210 | Tragic 11.6% |
Jamaican Male Disability Correlation Summary
| Measurement | Jamaican Data | Male Disability Data |
| Minimum | 0.098% | 4.2% |
| Maximum | 45.4% | 20.1% |
| Range | 45.3% | 15.9% |
| Mean | 11.1% | 11.5% |
| Median | 9.4% | 11.6% |
| Interquartile 25% (IQ1) | 4.7% | 10.2% |
| Interquartile 75% (IQ3) | 16.0% | 13.1% |
| Interquartile Range (IQR) | 11.3% | 2.9% |
| Standard Deviation (Sample) | 8.6% | 2.7% |
| Standard Deviation (Population) | 8.5% | 2.7% |
Correlation Details
| Jamaican Percentile | Sample Size | Male Disability |
[ 0.0% - 0.5% ] 0.098% | 212,847,054 | 11.6% |
[ 0.0% - 0.5% ] 0.32% | 56,771,053 | 11.9% |
[ 0.5% - 1.0% ] 0.57% | 24,458,362 | 12.3% |
[ 0.5% - 1.0% ] 0.79% | 17,475,706 | 12.5% |
[ 1.0% - 1.5% ] 1.02% | 10,173,551 | 12.3% |
[ 1.0% - 1.5% ] 1.24% | 6,749,492 | 11.9% |
[ 1.0% - 1.5% ] 1.46% | 5,426,256 | 11.6% |
[ 1.5% - 2.0% ] 1.71% | 3,912,107 | 11.6% |
[ 1.5% - 2.0% ] 1.93% | 3,084,406 | 11.5% |
[ 2.0% - 2.5% ] 2.15% | 2,532,832 | 11.6% |
[ 2.0% - 2.5% ] 2.40% | 1,285,040 | 11.6% |
[ 2.5% - 3.0% ] 2.52% | 10,260,437 | 10.3% |
[ 2.5% - 3.0% ] 2.85% | 926,375 | 11.7% |
[ 3.0% - 3.5% ] 3.04% | 1,391,820 | 11.5% |
[ 3.0% - 3.5% ] 3.32% | 1,264,004 | 12.9% |
[ 3.5% - 4.0% ] 3.52% | 634,262 | 10.5% |
[ 3.5% - 4.0% ] 3.76% | 674,261 | 10.9% |
[ 3.5% - 4.0% ] 3.98% | 511,884 | 12.1% |
[ 4.0% - 4.5% ] 4.16% | 340,721 | 10.4% |
[ 4.0% - 4.5% ] 4.44% | 584,124 | 11.8% |
[ 4.5% - 5.0% ] 4.65% | 540,500 | 14.6% |
[ 4.5% - 5.0% ] 4.85% | 416,475 | 11.4% |
[ 5.0% - 5.5% ] 5.10% | 152,962 | 13.7% |
[ 5.0% - 5.5% ] 5.35% | 201,661 | 11.5% |
[ 5.5% - 6.0% ] 5.56% | 313,909 | 12.0% |
[ 5.5% - 6.0% ] 5.75% | 367,752 | 10.0% |
[ 6.0% - 6.5% ] 6.00% | 358,301 | 11.8% |
[ 6.0% - 6.5% ] 6.19% | 67,821 | 11.1% |
[ 6.0% - 6.5% ] 6.43% | 183,080 | 12.5% |
[ 6.5% - 7.0% ] 6.69% | 427,938 | 9.8% |
[ 6.5% - 7.0% ] 6.86% | 156,040 | 13.1% |
[ 7.0% - 7.5% ] 7.20% | 346,080 | 12.9% |
[ 7.0% - 7.5% ] 7.33% | 140,396 | 13.8% |
[ 7.5% - 8.0% ] 7.62% | 7,418 | 11.6% |
[ 7.5% - 8.0% ] 7.80% | 162,063 | 10.6% |
[ 8.0% - 8.5% ] 8.09% | 150,471 | 13.5% |
[ 8.0% - 8.5% ] 8.33% | 138,522 | 8.1% |
[ 8.0% - 8.5% ] 8.49% | 197,052 | 12.3% |
[ 8.5% - 9.0% ] 8.69% | 101,391 | 15.0% |
[ 8.5% - 9.0% ] 8.96% | 154,467 | 12.0% |
[ 9.0% - 9.5% ] 9.25% | 40,619 | 9.0% |
[ 9.5% - 10.0% ] 9.64% | 43,733 | 12.8% |
[ 9.5% - 10.0% ] 9.78% | 139,481 | 13.4% |
[ 10.0% - 10.5% ] 10.13% | 81,502 | 13.5% |
[ 10.0% - 10.5% ] 10.28% | 63,088 | 15.5% |
[ 10.5% - 11.0% ] 10.51% | 124,075 | 13.4% |
[ 10.5% - 11.0% ] 10.84% | 38,865 | 7.7% |
[ 10.5% - 11.0% ] 10.99% | 74,916 | 7.4% |
[ 11.0% - 11.5% ] 11.24% | 94,486 | 10.8% |
[ 11.0% - 11.5% ] 11.38% | 43,517 | 13.2% |
[ 11.5% - 12.0% ] 11.64% | 739 | 18.9% |
[ 11.5% - 12.0% ] 11.84% | 135,158 | 7.2% |
[ 12.0% - 12.5% ] 12.38% | 80,728 | 10.3% |
[ 12.5% - 13.0% ] 12.70% | 13,781 | 8.9% |
[ 12.5% - 13.0% ] 12.81% | 640 | 17.1% |
[ 13.0% - 13.5% ] 13.08% | 3,571 | 13.5% |
[ 14.0% - 14.5% ] 14.23% | 78,506 | 8.9% |
[ 14.0% - 14.5% ] 14.45% | 68,431 | 9.1% |
[ 14.5% - 15.0% ] 14.65% | 13,479 | 14.0% |
[ 14.5% - 15.0% ] 14.77% | 27,845 | 8.1% |
[ 15.5% - 16.0% ] 15.69% | 1,950 | 11.4% |
[ 15.5% - 16.0% ] 15.95% | 163 | 6.2% |
[ 16.0% - 16.5% ] 16.43% | 121,912 | 8.7% |
[ 17.0% - 17.5% ] 17.21% | 22,486 | 13.2% |
[ 17.5% - 18.0% ] 17.62% | 104,158 | 11.0% |
[ 17.5% - 18.0% ] 17.71% | 72,817 | 11.8% |
[ 19.0% - 19.5% ] 19.03% | 310 | 10.2% |
[ 19.0% - 19.5% ] 19.16% | 62,232 | 7.4% |
[ 19.0% - 19.5% ] 19.31% | 47,516 | 10.2% |
[ 19.5% - 20.0% ] 19.62% | 40,073 | 13.2% |
[ 19.5% - 20.0% ] 19.85% | 72,581 | 14.0% |
[ 20.0% - 20.5% ] 20.02% | 52,792 | 9.9% |
[ 20.0% - 20.5% ] 20.24% | 40,593 | 9.6% |
[ 21.0% - 21.5% ] 21.47% | 35,914 | 17.2% |
[ 22.5% - 23.0% ] 22.90% | 118,819 | 8.3% |
[ 23.5% - 24.0% ] 23.79% | 52,000 | 10.7% |
[ 24.0% - 24.5% ] 24.06% | 10,526 | 11.3% |
[ 26.5% - 27.0% ] 26.59% | 21,977 | 14.2% |
[ 27.0% - 27.5% ] 27.26% | 543 | 4.2% |
[ 28.5% - 29.0% ] 28.55% | 641 | 5.4% |
[ 35.5% - 36.0% ] 35.52% | 2,224 | 20.1% |
[ 45.0% - 45.5% ] 45.38% | 130 | 9.3% |