Jamaican Married-couple Households
COMPARE
Jamaican
Select to Compare
Married-couple Households
Jamaican Married-couple Households
40.9%
MARRIED-COUPLE HOUSEHOLDS
0.0/ 100
METRIC RATING
314th/ 347
METRIC RANK
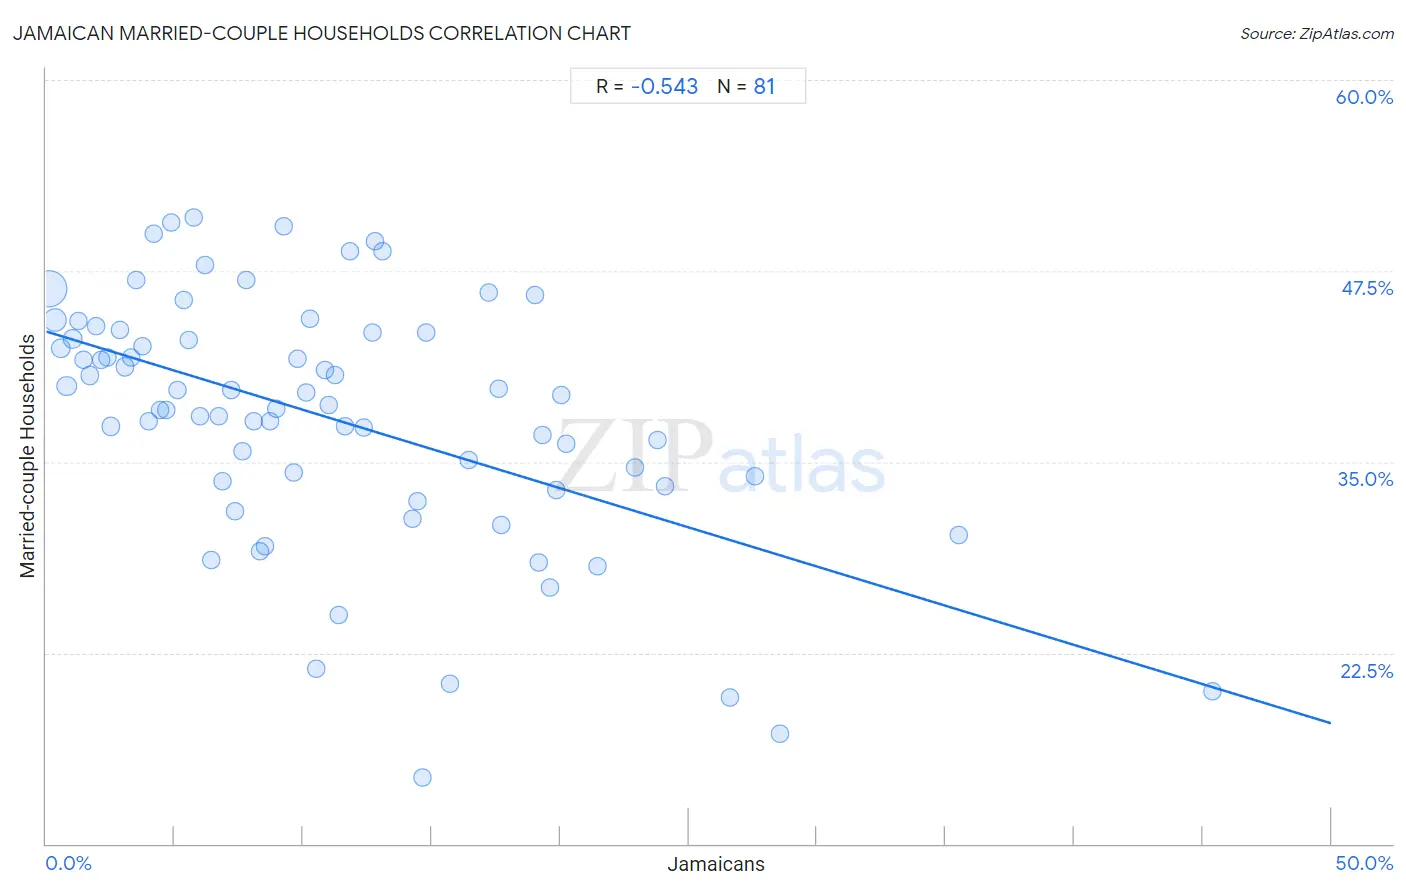
Jamaican Married-couple Households Correlation Chart
The statistical analysis conducted on geographies consisting of 367,621,560 people shows a substantial negative correlation between the proportion of Jamaicans and percentage of married-couple family households in the United States with a correlation coefficient (R) of -0.543 and weighted average of 40.9%. On average, for every 1% (one percent) increase in Jamaicans within a typical geography, there is a decrease of 0.51% in percentage of married-couple family households.
It is essential to understand that the correlation between the percentage of Jamaicans and percentage of married-couple family households does not imply a direct cause-and-effect relationship. It remains uncertain whether the presence of Jamaicans influences an upward or downward trend in the level of percentage of married-couple family households within an area, or if Jamaicans simply ended up residing in those areas with higher or lower levels of percentage of married-couple family households due to other factors.
Demographics Similar to Jamaicans by Married-couple Households
In terms of married-couple households, the demographic groups most similar to Jamaicans are Immigrants from Haiti (40.9%, a difference of 0.080%), Trinidadian and Tobagonian (40.9%, a difference of 0.080%), African (40.9%, a difference of 0.14%), Colville (41.0%, a difference of 0.22%), and Immigrants from Caribbean (40.8%, a difference of 0.26%).
| Demographics | Rating | Rank | Married-couple Households |
| Immigrants from Western Africa | 0.0 /100 | #307 | Tragic 41.4% |
| Crow | 0.0 /100 | #308 | Tragic 41.4% |
| Immigrants from Trinidad and Tobago | 0.0 /100 | #309 | Tragic 41.2% |
| Haitians | 0.0 /100 | #310 | Tragic 41.2% |
| Colville | 0.0 /100 | #311 | Tragic 41.0% |
| Africans | 0.0 /100 | #312 | Tragic 40.9% |
| Immigrants from Haiti | 0.0 /100 | #313 | Tragic 40.9% |
| Jamaicans | 0.0 /100 | #314 | Tragic 40.9% |
| Trinidadians and Tobagonians | 0.0 /100 | #315 | Tragic 40.9% |
| Immigrants from Caribbean | 0.0 /100 | #316 | Tragic 40.8% |
| Immigrants from Jamaica | 0.0 /100 | #317 | Tragic 40.7% |
| Liberians | 0.0 /100 | #318 | Tragic 40.7% |
| Bahamians | 0.0 /100 | #319 | Tragic 40.5% |
| West Indians | 0.0 /100 | #320 | Tragic 40.3% |
| Immigrants from Liberia | 0.0 /100 | #321 | Tragic 40.3% |
Jamaican Married-couple Households Correlation Summary
| Measurement | Jamaican Data | Married-couple Households Data |
| Minimum | 0.098% | 14.3% |
| Maximum | 45.4% | 51.0% |
| Range | 45.3% | 36.7% |
| Mean | 11.1% | 37.9% |
| Median | 9.2% | 38.7% |
| Interquartile 25% (IQ1) | 4.5% | 33.6% |
| Interquartile 75% (IQ3) | 16.1% | 43.5% |
| Interquartile Range (IQR) | 11.5% | 9.9% |
| Standard Deviation (Sample) | 8.6% | 8.1% |
| Standard Deviation (Population) | 8.5% | 8.1% |
Correlation Details
| Jamaican Percentile | Sample Size | Married-couple Households |
[ 0.0% - 0.5% ] 0.098% | 212,764,923 | 46.4% |
[ 0.0% - 0.5% ] 0.32% | 56,709,634 | 44.3% |
[ 0.5% - 1.0% ] 0.57% | 24,403,877 | 42.4% |
[ 0.5% - 1.0% ] 0.79% | 17,463,415 | 40.0% |
[ 1.0% - 1.5% ] 1.02% | 10,145,615 | 43.0% |
[ 1.0% - 1.5% ] 1.24% | 6,745,201 | 44.2% |
[ 1.0% - 1.5% ] 1.46% | 5,411,619 | 41.7% |
[ 1.5% - 2.0% ] 1.71% | 3,895,647 | 40.7% |
[ 1.5% - 2.0% ] 1.93% | 3,081,135 | 43.9% |
[ 2.0% - 2.5% ] 2.15% | 2,518,587 | 41.7% |
[ 2.0% - 2.5% ] 2.40% | 1,275,900 | 41.8% |
[ 2.5% - 3.0% ] 2.52% | 10,260,437 | 37.3% |
[ 2.5% - 3.0% ] 2.85% | 925,058 | 43.7% |
[ 3.0% - 3.5% ] 3.04% | 1,386,713 | 41.2% |
[ 3.0% - 3.5% ] 3.32% | 1,264,004 | 41.8% |
[ 3.5% - 4.0% ] 3.52% | 632,497 | 46.9% |
[ 3.5% - 4.0% ] 3.77% | 666,159 | 42.6% |
[ 3.5% - 4.0% ] 3.98% | 511,884 | 37.6% |
[ 4.0% - 4.5% ] 4.16% | 340,210 | 49.9% |
[ 4.0% - 4.5% ] 4.44% | 584,124 | 38.4% |
[ 4.5% - 5.0% ] 4.65% | 540,500 | 38.4% |
[ 4.5% - 5.0% ] 4.85% | 417,036 | 50.6% |
[ 5.0% - 5.5% ] 5.10% | 152,962 | 39.7% |
[ 5.0% - 5.5% ] 5.35% | 201,661 | 45.6% |
[ 5.5% - 6.0% ] 5.56% | 311,925 | 42.9% |
[ 5.5% - 6.0% ] 5.75% | 370,061 | 51.0% |
[ 6.0% - 6.5% ] 6.00% | 358,301 | 38.0% |
[ 6.0% - 6.5% ] 6.19% | 66,618 | 47.9% |
[ 6.0% - 6.5% ] 6.43% | 183,080 | 28.5% |
[ 6.5% - 7.0% ] 6.69% | 427,938 | 38.0% |
[ 6.5% - 7.0% ] 6.86% | 156,040 | 33.7% |
[ 7.0% - 7.5% ] 7.20% | 346,080 | 39.7% |
[ 7.0% - 7.5% ] 7.33% | 140,396 | 31.8% |
[ 7.5% - 8.0% ] 7.62% | 7,418 | 35.7% |
[ 7.5% - 8.0% ] 7.80% | 162,063 | 46.9% |
[ 8.0% - 8.5% ] 8.09% | 150,471 | 37.7% |
[ 8.0% - 8.5% ] 8.33% | 138,522 | 29.2% |
[ 8.0% - 8.5% ] 8.49% | 197,052 | 29.4% |
[ 8.5% - 9.0% ] 8.69% | 101,391 | 37.7% |
[ 8.5% - 9.0% ] 8.96% | 154,467 | 38.5% |
[ 9.0% - 9.5% ] 9.25% | 40,619 | 50.4% |
[ 9.5% - 10.0% ] 9.64% | 43,733 | 34.3% |
[ 9.5% - 10.0% ] 9.78% | 139,481 | 41.7% |
[ 10.0% - 10.5% ] 10.13% | 81,502 | 39.6% |
[ 10.0% - 10.5% ] 10.28% | 63,088 | 44.4% |
[ 10.5% - 11.0% ] 10.51% | 124,075 | 21.5% |
[ 10.5% - 11.0% ] 10.84% | 39,495 | 41.0% |
[ 10.5% - 11.0% ] 10.99% | 74,916 | 38.7% |
[ 11.0% - 11.5% ] 11.24% | 94,486 | 40.7% |
[ 11.0% - 11.5% ] 11.38% | 43,517 | 24.9% |
[ 11.5% - 12.0% ] 11.64% | 739 | 37.4% |
[ 11.5% - 12.0% ] 11.84% | 135,158 | 48.8% |
[ 12.0% - 12.5% ] 12.38% | 80,728 | 37.2% |
[ 12.5% - 13.0% ] 12.70% | 14,549 | 43.5% |
[ 12.5% - 13.0% ] 12.81% | 640 | 49.5% |
[ 13.0% - 13.5% ] 13.08% | 3,571 | 48.8% |
[ 14.0% - 14.5% ] 14.23% | 78,506 | 31.3% |
[ 14.0% - 14.5% ] 14.45% | 68,431 | 32.4% |
[ 14.5% - 15.0% ] 14.65% | 13,479 | 14.3% |
[ 14.5% - 15.0% ] 14.77% | 27,845 | 43.5% |
[ 15.5% - 16.0% ] 15.69% | 2,039 | 20.5% |
[ 16.0% - 16.5% ] 16.43% | 121,912 | 35.1% |
[ 17.0% - 17.5% ] 17.21% | 22,486 | 46.1% |
[ 17.5% - 18.0% ] 17.62% | 104,158 | 39.8% |
[ 17.5% - 18.0% ] 17.71% | 72,817 | 30.9% |
[ 19.0% - 19.5% ] 19.03% | 310 | 45.9% |
[ 19.0% - 19.5% ] 19.16% | 62,232 | 28.4% |
[ 19.0% - 19.5% ] 19.31% | 47,516 | 36.7% |
[ 19.5% - 20.0% ] 19.62% | 40,073 | 26.8% |
[ 19.5% - 20.0% ] 19.85% | 72,581 | 33.2% |
[ 20.0% - 20.5% ] 20.02% | 52,792 | 39.4% |
[ 20.0% - 20.5% ] 20.24% | 40,672 | 36.2% |
[ 21.0% - 21.5% ] 21.47% | 35,914 | 28.2% |
[ 22.5% - 23.0% ] 22.90% | 118,819 | 34.7% |
[ 23.5% - 24.0% ] 23.79% | 52,000 | 36.4% |
[ 24.0% - 24.5% ] 24.06% | 10,526 | 33.4% |
[ 26.5% - 27.0% ] 26.59% | 21,977 | 19.6% |
[ 27.5% - 28.0% ] 27.58% | 562 | 34.1% |
[ 28.5% - 29.0% ] 28.55% | 641 | 17.2% |
[ 35.5% - 36.0% ] 35.52% | 2,224 | 30.2% |
[ 45.0% - 45.5% ] 45.38% | 130 | 20.0% |