Jamaican Disability Age Under 5
COMPARE
Jamaican
Select to Compare
Disability Age Under 5
Jamaican Disability Age Under 5
1.3%
DISABILITY | AGE UNDER 5
30.7/ 100
METRIC RATING
199th/ 347
METRIC RANK
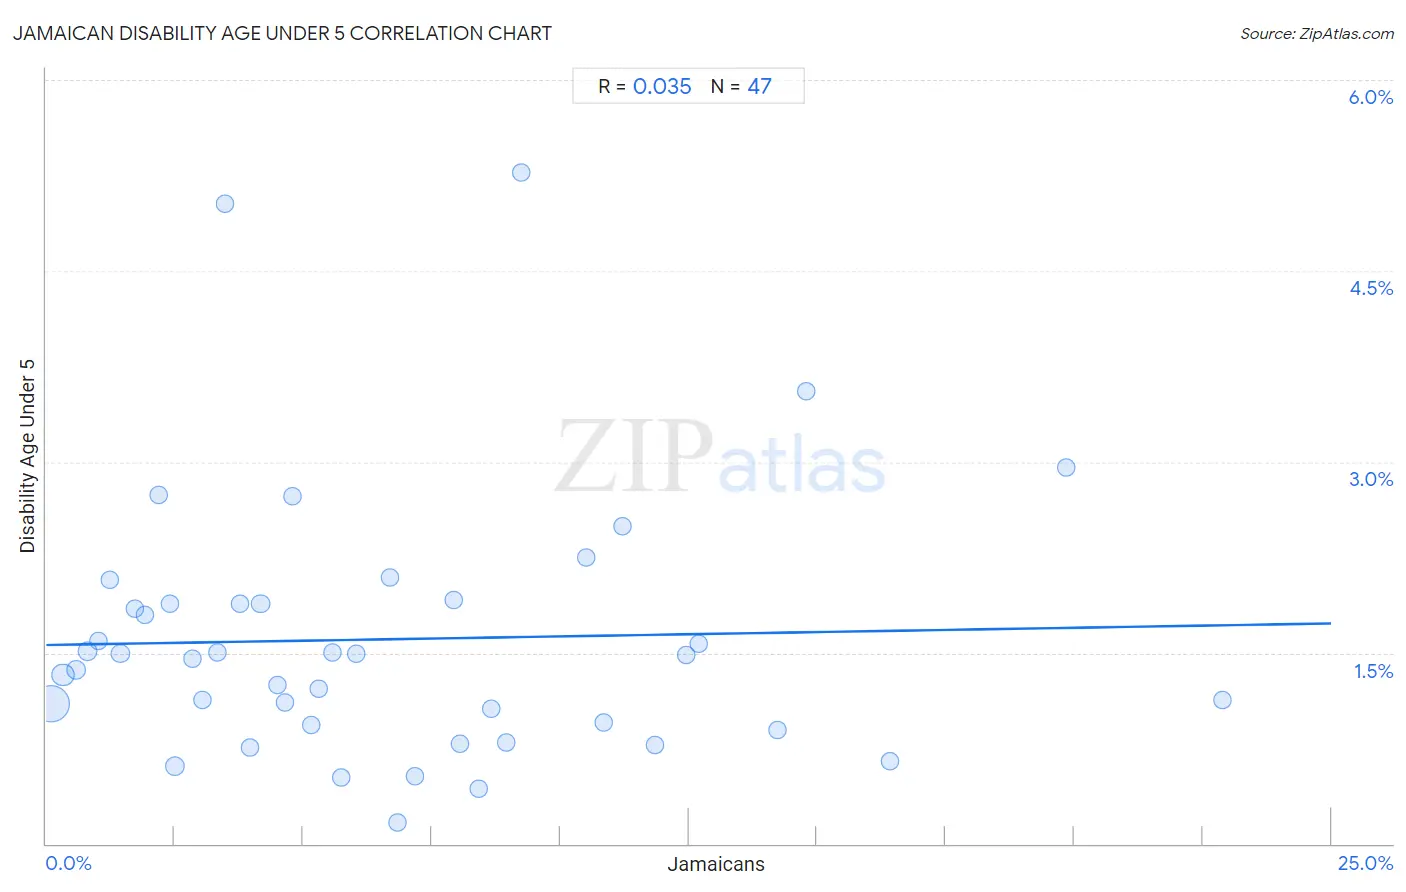
Jamaican Disability Age Under 5 Correlation Chart
The statistical analysis conducted on geographies consisting of 204,154,709 people shows no correlation between the proportion of Jamaicans and percentage of population with a disability under the age of 5 in the United States with a correlation coefficient (R) of 0.035 and weighted average of 1.3%. On average, for every 1% (one percent) increase in Jamaicans within a typical geography, there is an increase of 0.0068% in percentage of population with a disability under the age of 5.
It is essential to understand that the correlation between the percentage of Jamaicans and percentage of population with a disability under the age of 5 does not imply a direct cause-and-effect relationship. It remains uncertain whether the presence of Jamaicans influences an upward or downward trend in the level of percentage of population with a disability under the age of 5 within an area, or if Jamaicans simply ended up residing in those areas with higher or lower levels of percentage of population with a disability under the age of 5 due to other factors.
Demographics Similar to Jamaicans by Disability Age Under 5
In terms of disability age under 5, the demographic groups most similar to Jamaicans are Immigrants from Norway (1.3%, a difference of 0.040%), Immigrants from Somalia (1.3%, a difference of 0.070%), Immigrants from Belgium (1.3%, a difference of 0.080%), U.S. Virgin Islander (1.3%, a difference of 0.38%), and Immigrants from Lithuania (1.3%, a difference of 0.38%).
| Demographics | Rating | Rank | Disability Age Under 5 |
| Immigrants from Bosnia and Herzegovina | 36.5 /100 | #192 | Fair 1.3% |
| Immigrants from Sierra Leone | 36.5 /100 | #193 | Fair 1.3% |
| Immigrants from North Macedonia | 34.7 /100 | #194 | Fair 1.3% |
| U.S. Virgin Islanders | 34.4 /100 | #195 | Fair 1.3% |
| Immigrants from Belgium | 31.4 /100 | #196 | Fair 1.3% |
| Immigrants from Somalia | 31.3 /100 | #197 | Fair 1.3% |
| Immigrants from Norway | 31.1 /100 | #198 | Fair 1.3% |
| Jamaicans | 30.7 /100 | #199 | Fair 1.3% |
| Immigrants from Lithuania | 27.2 /100 | #200 | Fair 1.3% |
| Immigrants from Italy | 25.4 /100 | #201 | Fair 1.3% |
| Arapaho | 24.1 /100 | #202 | Fair 1.3% |
| Liberians | 24.0 /100 | #203 | Fair 1.3% |
| Immigrants from Europe | 23.6 /100 | #204 | Fair 1.3% |
| Romanians | 22.5 /100 | #205 | Fair 1.3% |
| Immigrants from Poland | 22.4 /100 | #206 | Fair 1.3% |
Jamaican Disability Age Under 5 Correlation Summary
| Measurement | Jamaican Data | Disability Age Under 5 Data |
| Minimum | 0.100% | 0.17% |
| Maximum | 22.9% | 5.3% |
| Range | 22.8% | 5.1% |
| Mean | 6.6% | 1.6% |
| Median | 5.3% | 1.5% |
| Interquartile 25% (IQ1) | 2.5% | 0.93% |
| Interquartile 75% (IQ3) | 9.2% | 1.9% |
| Interquartile Range (IQR) | 6.7% | 0.95% |
| Standard Deviation (Sample) | 5.2% | 1.0% |
| Standard Deviation (Population) | 5.2% | 1.0% |
Correlation Details
| Jamaican Percentile | Sample Size | Disability Age Under 5 |
[ 0.0% - 0.5% ] 0.100% | 129,169,807 | 1.1% |
[ 0.0% - 0.5% ] 0.32% | 27,519,255 | 1.3% |
[ 0.5% - 1.0% ] 0.57% | 10,172,072 | 1.4% |
[ 0.5% - 1.0% ] 0.80% | 8,510,521 | 1.5% |
[ 1.0% - 1.5% ] 1.02% | 4,285,270 | 1.6% |
[ 1.0% - 1.5% ] 1.24% | 2,380,015 | 2.1% |
[ 1.0% - 1.5% ] 1.44% | 2,865,829 | 1.5% |
[ 1.5% - 2.0% ] 1.73% | 1,594,097 | 1.8% |
[ 1.5% - 2.0% ] 1.92% | 1,398,212 | 1.8% |
[ 2.0% - 2.5% ] 2.19% | 876,885 | 2.7% |
[ 2.0% - 2.5% ] 2.41% | 508,534 | 1.9% |
[ 2.5% - 3.0% ] 2.51% | 9,638,435 | 0.61% |
[ 2.5% - 3.0% ] 2.84% | 334,816 | 1.5% |
[ 3.0% - 3.5% ] 3.04% | 762,231 | 1.1% |
[ 3.0% - 3.5% ] 3.32% | 685,822 | 1.5% |
[ 3.0% - 3.5% ] 3.48% | 24,751 | 5.0% |
[ 3.5% - 4.0% ] 3.77% | 318,237 | 1.9% |
[ 3.5% - 4.0% ] 3.97% | 97,652 | 0.76% |
[ 4.0% - 4.5% ] 4.17% | 154,134 | 1.9% |
[ 4.5% - 5.0% ] 4.50% | 229,999 | 1.2% |
[ 4.5% - 5.0% ] 4.65% | 324,108 | 1.1% |
[ 4.5% - 5.0% ] 4.78% | 39,528 | 2.7% |
[ 5.0% - 5.5% ] 5.15% | 47,823 | 0.93% |
[ 5.0% - 5.5% ] 5.30% | 81,283 | 1.2% |
[ 5.5% - 6.0% ] 5.58% | 182,052 | 1.5% |
[ 5.5% - 6.0% ] 5.74% | 157,387 | 0.52% |
[ 6.0% - 6.5% ] 6.02% | 166,688 | 1.5% |
[ 6.5% - 7.0% ] 6.70% | 242,652 | 2.1% |
[ 6.5% - 7.0% ] 6.83% | 115,891 | 0.17% |
[ 7.0% - 7.5% ] 7.17% | 174,608 | 0.53% |
[ 7.5% - 8.0% ] 7.92% | 9,246 | 1.9% |
[ 8.0% - 8.5% ] 8.06% | 37,274 | 0.78% |
[ 8.0% - 8.5% ] 8.41% | 111,618 | 0.43% |
[ 8.5% - 9.0% ] 8.66% | 83,221 | 1.1% |
[ 8.5% - 9.0% ] 8.94% | 96,510 | 0.79% |
[ 9.0% - 9.5% ] 9.24% | 19,016 | 5.3% |
[ 10.5% - 11.0% ] 10.51% | 121,057 | 2.2% |
[ 10.5% - 11.0% ] 10.84% | 38,865 | 0.95% |
[ 11.0% - 11.5% ] 11.22% | 71,749 | 2.5% |
[ 11.5% - 12.0% ] 11.84% | 135,158 | 0.77% |
[ 12.0% - 12.5% ] 12.46% | 35,082 | 1.5% |
[ 12.5% - 13.0% ] 12.70% | 13,781 | 1.6% |
[ 14.0% - 14.5% ] 14.23% | 78,506 | 0.89% |
[ 14.5% - 15.0% ] 14.77% | 27,845 | 3.6% |
[ 16.0% - 16.5% ] 16.42% | 100,082 | 0.65% |
[ 19.5% - 20.0% ] 19.85% | 72,273 | 3.0% |
[ 22.5% - 23.0% ] 22.89% | 44,832 | 1.1% |