Jamaican Married-Couple Family Poverty
COMPARE
Jamaican
Select to Compare
Married-Couple Family Poverty
Jamaican Married-Couple Family Poverty
6.1%
POVERTY | MARRIED-COUPLE FAMILIES
0.3/ 100
METRIC RATING
260th/ 347
METRIC RANK
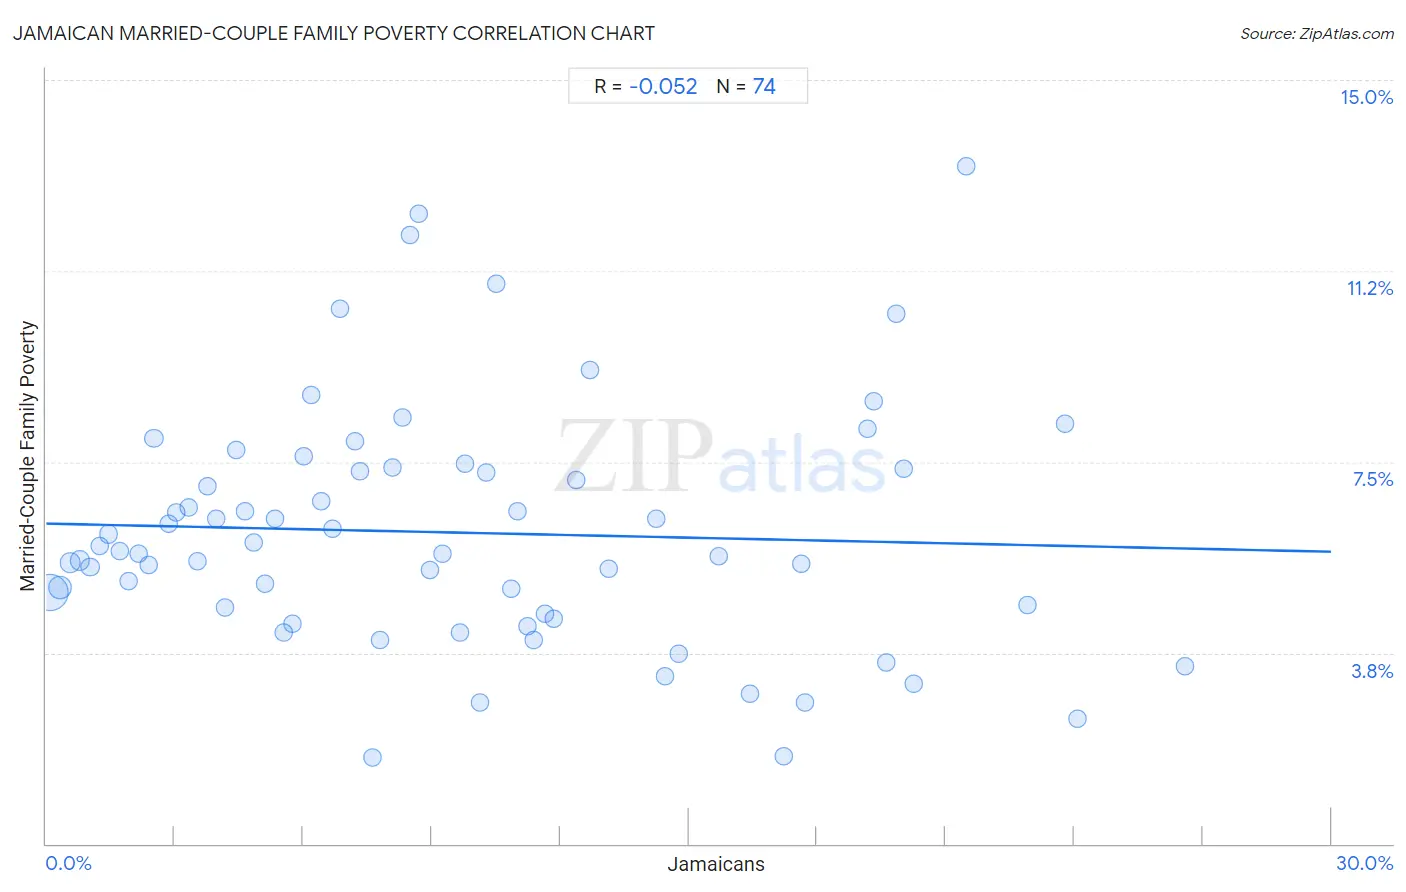
Jamaican Married-Couple Family Poverty Correlation Chart
The statistical analysis conducted on geographies consisting of 364,819,345 people shows a slight negative correlation between the proportion of Jamaicans and poverty level among married-couple families in the United States with a correlation coefficient (R) of -0.052 and weighted average of 6.1%. On average, for every 1% (one percent) increase in Jamaicans within a typical geography, there is a decrease of 0.018% in poverty level among married-couple families.
It is essential to understand that the correlation between the percentage of Jamaicans and poverty level among married-couple families does not imply a direct cause-and-effect relationship. It remains uncertain whether the presence of Jamaicans influences an upward or downward trend in the level of poverty level among married-couple families within an area, or if Jamaicans simply ended up residing in those areas with higher or lower levels of poverty level among married-couple families due to other factors.
Demographics Similar to Jamaicans by Married-Couple Family Poverty
In terms of married-couple family poverty, the demographic groups most similar to Jamaicans are Senegalese (6.1%, a difference of 0.19%), Alaskan Athabascan (6.1%, a difference of 0.21%), Shoshone (6.1%, a difference of 0.40%), Immigrants (6.0%, a difference of 0.79%), and Immigrants from Senegal (6.1%, a difference of 0.79%).
| Demographics | Rating | Rank | Married-Couple Family Poverty |
| Africans | 0.7 /100 | #253 | Tragic 6.0% |
| Immigrants from Somalia | 0.7 /100 | #254 | Tragic 6.0% |
| Comanche | 0.7 /100 | #255 | Tragic 6.0% |
| Bangladeshis | 0.5 /100 | #256 | Tragic 6.0% |
| Immigrants from Burma/Myanmar | 0.5 /100 | #257 | Tragic 6.0% |
| Immigrants | 0.5 /100 | #258 | Tragic 6.0% |
| Alaskan Athabascans | 0.4 /100 | #259 | Tragic 6.1% |
| Jamaicans | 0.3 /100 | #260 | Tragic 6.1% |
| Senegalese | 0.3 /100 | #261 | Tragic 6.1% |
| Shoshone | 0.3 /100 | #262 | Tragic 6.1% |
| Immigrants from Senegal | 0.3 /100 | #263 | Tragic 6.1% |
| Immigrants from Congo | 0.2 /100 | #264 | Tragic 6.1% |
| Blackfeet | 0.2 /100 | #265 | Tragic 6.2% |
| Creek | 0.2 /100 | #266 | Tragic 6.2% |
| Spanish Americans | 0.2 /100 | #267 | Tragic 6.2% |
Jamaican Married-Couple Family Poverty Correlation Summary
| Measurement | Jamaican Data | Married-Couple Family Poverty Data |
| Minimum | 0.098% | 1.7% |
| Maximum | 26.6% | 13.3% |
| Range | 26.5% | 11.6% |
| Mean | 9.6% | 6.1% |
| Median | 8.4% | 5.7% |
| Interquartile 25% (IQ1) | 4.2% | 4.5% |
| Interquartile 75% (IQ3) | 14.2% | 7.4% |
| Interquartile Range (IQR) | 10.1% | 2.8% |
| Standard Deviation (Sample) | 6.7% | 2.4% |
| Standard Deviation (Population) | 6.7% | 2.4% |
Correlation Details
| Jamaican Percentile | Sample Size | Married-Couple Family Poverty |
[ 0.0% - 0.5% ] 0.098% | 211,909,976 | 4.9% |
[ 0.0% - 0.5% ] 0.32% | 56,034,743 | 5.0% |
[ 0.5% - 1.0% ] 0.57% | 24,157,370 | 5.5% |
[ 0.5% - 1.0% ] 0.79% | 17,141,920 | 5.6% |
[ 1.0% - 1.5% ] 1.02% | 10,049,186 | 5.4% |
[ 1.0% - 1.5% ] 1.24% | 6,669,281 | 5.8% |
[ 1.0% - 1.5% ] 1.46% | 5,341,005 | 6.1% |
[ 1.5% - 2.0% ] 1.71% | 3,829,811 | 5.7% |
[ 1.5% - 2.0% ] 1.93% | 3,036,720 | 5.2% |
[ 2.0% - 2.5% ] 2.15% | 2,491,721 | 5.7% |
[ 2.0% - 2.5% ] 2.40% | 1,248,148 | 5.5% |
[ 2.5% - 3.0% ] 2.52% | 10,227,876 | 8.0% |
[ 2.5% - 3.0% ] 2.85% | 903,775 | 6.3% |
[ 3.0% - 3.5% ] 3.04% | 1,372,310 | 6.5% |
[ 3.0% - 3.5% ] 3.32% | 1,255,579 | 6.6% |
[ 3.5% - 4.0% ] 3.52% | 617,254 | 5.5% |
[ 3.5% - 4.0% ] 3.77% | 651,535 | 7.0% |
[ 3.5% - 4.0% ] 3.98% | 484,040 | 6.4% |
[ 4.0% - 4.5% ] 4.16% | 340,210 | 4.7% |
[ 4.0% - 4.5% ] 4.44% | 583,467 | 7.7% |
[ 4.5% - 5.0% ] 4.65% | 538,178 | 6.5% |
[ 4.5% - 5.0% ] 4.85% | 399,683 | 5.9% |
[ 5.0% - 5.5% ] 5.11% | 143,407 | 5.1% |
[ 5.0% - 5.5% ] 5.35% | 199,658 | 6.4% |
[ 5.5% - 6.0% ] 5.56% | 293,722 | 4.1% |
[ 5.5% - 6.0% ] 5.74% | 343,056 | 4.3% |
[ 5.5% - 6.0% ] 6.00% | 354,601 | 7.6% |
[ 6.0% - 6.5% ] 6.19% | 64,452 | 8.8% |
[ 6.0% - 6.5% ] 6.43% | 181,519 | 6.7% |
[ 6.5% - 7.0% ] 6.69% | 425,047 | 6.2% |
[ 6.5% - 7.0% ] 6.86% | 153,738 | 10.5% |
[ 7.0% - 7.5% ] 7.20% | 344,225 | 7.9% |
[ 7.0% - 7.5% ] 7.33% | 134,674 | 7.3% |
[ 7.5% - 8.0% ] 7.62% | 7,365 | 1.7% |
[ 7.5% - 8.0% ] 7.80% | 160,308 | 4.0% |
[ 8.0% - 8.5% ] 8.09% | 150,421 | 7.4% |
[ 8.0% - 8.5% ] 8.33% | 138,522 | 8.4% |
[ 8.0% - 8.5% ] 8.49% | 195,624 | 12.0% |
[ 8.5% - 9.0% ] 8.69% | 101,391 | 12.4% |
[ 8.5% - 9.0% ] 8.96% | 151,551 | 5.4% |
[ 9.0% - 9.5% ] 9.26% | 21,603 | 5.7% |
[ 9.5% - 10.0% ] 9.65% | 37,829 | 4.1% |
[ 9.5% - 10.0% ] 9.78% | 137,260 | 7.5% |
[ 10.0% - 10.5% ] 10.13% | 81,253 | 2.8% |
[ 10.0% - 10.5% ] 10.28% | 63,088 | 7.3% |
[ 10.5% - 11.0% ] 10.51% | 123,924 | 11.0% |
[ 10.5% - 11.0% ] 10.84% | 39,495 | 5.0% |
[ 10.5% - 11.0% ] 10.99% | 72,684 | 6.5% |
[ 11.0% - 11.5% ] 11.24% | 94,486 | 4.3% |
[ 11.0% - 11.5% ] 11.38% | 43,517 | 4.0% |
[ 11.5% - 12.0% ] 11.64% | 739 | 4.5% |
[ 11.5% - 12.0% ] 11.84% | 135,158 | 4.4% |
[ 12.0% - 12.5% ] 12.38% | 78,641 | 7.1% |
[ 12.5% - 13.0% ] 12.70% | 13,781 | 9.3% |
[ 13.0% - 13.5% ] 13.13% | 655 | 5.4% |
[ 14.0% - 14.5% ] 14.23% | 78,506 | 6.4% |
[ 14.0% - 14.5% ] 14.45% | 68,182 | 3.3% |
[ 14.5% - 15.0% ] 14.77% | 27,845 | 3.7% |
[ 15.5% - 16.0% ] 15.69% | 1,950 | 5.6% |
[ 16.0% - 16.5% ] 16.43% | 121,542 | 2.9% |
[ 17.0% - 17.5% ] 17.22% | 21,329 | 1.7% |
[ 17.5% - 18.0% ] 17.62% | 104,158 | 5.5% |
[ 17.5% - 18.0% ] 17.71% | 72,817 | 2.8% |
[ 19.0% - 19.5% ] 19.16% | 62,232 | 8.2% |
[ 19.0% - 19.5% ] 19.31% | 44,635 | 8.7% |
[ 19.5% - 20.0% ] 19.62% | 40,073 | 3.6% |
[ 19.5% - 20.0% ] 19.85% | 72,273 | 10.4% |
[ 20.0% - 20.5% ] 20.02% | 52,792 | 7.4% |
[ 20.0% - 20.5% ] 20.24% | 40,593 | 3.2% |
[ 21.0% - 21.5% ] 21.47% | 35,914 | 13.3% |
[ 22.5% - 23.0% ] 22.90% | 118,819 | 4.7% |
[ 23.5% - 24.0% ] 23.79% | 52,000 | 8.2% |
[ 24.0% - 24.5% ] 24.06% | 10,526 | 2.5% |
[ 26.5% - 27.0% ] 26.59% | 21,977 | 3.5% |