Immigrants from North America 1 or more Vehicles in Household

COMPARE

Immigrants from North America
Race
Ancestry
AfghanAfricanAlaska NativeAlaskan AthabascanAlbanianAleutAlsatianAmericanApacheArabArapahoArgentineanArmenianAssyrian/Chaldean/SyriacAustralianAustrianBahamianBangladeshiBarbadianBasqueBelgianBelizeanBermudanBhutaneseBlackfeetBolivianBrazilianBritishBritish West IndianBulgarianBurmeseCajunCambodianCanadianCape VerdeanCarpatho RusynCelticCentral AmericanCentral American IndianCherokeeCheyenneChickasawChileanChineseChippewaChoctawColombianColvilleComancheCosta RicanCreeCreekCroatianCrowCubanCypriotCzechCzechoslovakianDanishDelawareDominicanDutchDutch West IndianEastern EuropeanEcuadorianEgyptianEnglishEstonianEthiopianEuropeanFijianFilipinoFinnishFrenchFrench American IndianFrench CanadianGermanGerman RussianGhanaianGreekGuamanian/ChamorroGuatemalanGuyaneseHaitianHmongHonduranHopiHoumaHungarianIcelanderIndian (Asian)IndonesianInupiatIranianIraqiIrishIroquoisIsraeliItalianJamaicanJapaneseJordanianKenyanKiowaKoreanLaotianLatvianLebaneseLiberianLithuanianLumbeeLuxembourgerMacedonianMalaysianMalteseMarshalleseMenomineeMexicanMexican American IndianMongolianMoroccanNative HawaiianNavajoNepaleseNew ZealanderNicaraguanNigerianNorthern EuropeanNorwegianOkinawanOsageOttawaPaiutePakistaniPalestinianPanamanianParaguayanPennsylvania GermanPeruvianPimaPolishPortuguesePotawatomiPuebloPuerto RicanPuget Sound SalishRomanianRussianSalvadoranSamoanScandinavianScotch-IrishScottishSeminoleSenegaleseSerbianShoshoneSierra LeoneanSiouxSlavicSlovakSloveneSomaliSouth AfricanSouth AmericanSouth American IndianSoviet UnionSpaniardSpanishSpanish AmericanSpanish American IndianSri LankanSubsaharan AfricanSudaneseSwedishSwissSyrianTaiwaneseThaiTlingit-HaidaTohono O'OdhamTonganTrinidadian and TobagonianTsimshianTurkishU.S. Virgin IslanderUgandanUkrainianUruguayanUteVenezuelanVietnameseWelshWest IndianYakamaYaquiYugoslavianYumanYup'ikZimbabwean
Immigration
NonimmigrantsImmigrantsAfghanistanAfricaAlbaniaArgentinaArmeniaAsiaAustraliaAustriaBahamasBangladeshBarbadosBelarusBelgiumBelizeBoliviaBosnia and HerzegovinaBrazilBulgariaBurma/MyanmarCabo VerdeCambodiaCameroonCanadaCaribbeanCentral AmericaChileChinaColombiaCongoCosta RicaCroatiaCubaCzechoslovakiaDenmarkDominicaDominican RepublicEastern AfricaEastern AsiaEastern EuropeEcuadorEgyptEl SalvadorEnglandEritreaEthiopiaEuropeFijiFranceGermanyGhanaGreeceGrenadaGuatemalaGuyanaHaitiHondurasHong KongHungaryIndiaIndonesiaIranIraqIrelandIsraelItalyJamaicaJapanJordanKazakhstanKenyaKoreaKuwaitLaosLatin AmericaLatviaLebanonLiberiaLithuaniaMalaysiaMexicoMicronesiaMiddle AfricaMoldovaMoroccoNepalNetherlandsNicaraguaNigeriaNorth AmericaNorth MacedoniaNorthern AfricaNorthern EuropeNorwayOceaniaPakistanPanamaPeruPhilippinesPolandPortugalRomaniaRussiaSaudi ArabiaScotlandSenegalSerbiaSierra LeoneSingaporeSomaliaSouth AfricaSouth AmericaSouth Central AsiaSouth Eastern AsiaSouthern EuropeSpainSri LankaSt. Vincent and the GrenadinesSudanSwedenSwitzerlandSyriaTaiwanThailandTrinidad and TobagoTurkeyUgandaUkraineUruguayUzbekistanVenezuelaVietnamWest IndiesWestern AfricaWestern AsiaWestern EuropeYemenZaireZimbabweAzores
Select to Compare
Race
Ancestry
AfghanAfricanAlaska NativeAlaskan AthabascanAlbanianAleutAlsatianAmericanApacheArabArapahoArgentineanArmenianAssyrian/Chaldean/SyriacAustralianAustrianBahamianBangladeshiBarbadianBasqueBelgianBelizeanBermudanBhutaneseBlackfeetBolivianBrazilianBritishBritish West IndianBulgarianBurmeseCajunCambodianCanadianCape VerdeanCarpatho RusynCelticCentral AmericanCentral American IndianCherokeeCheyenneChickasawChileanChineseChippewaChoctawColombianColvilleComancheCosta RicanCreeCreekCroatianCrowCubanCypriotCzechCzechoslovakianDanishDelawareDominicanDutchDutch West IndianEastern EuropeanEcuadorianEgyptianEnglishEstonianEthiopianEuropeanFijianFilipinoFinnishFrenchFrench American IndianFrench CanadianGermanGerman RussianGhanaianGreekGuamanian/ChamorroGuatemalanGuyaneseHaitianHmongHonduranHopiHoumaHungarianIcelanderIndian (Asian)IndonesianInupiatIranianIraqiIrishIroquoisIsraeliItalianJamaicanJapaneseJordanianKenyanKiowaKoreanLaotianLatvianLebaneseLiberianLithuanianLumbeeLuxembourgerMacedonianMalaysianMalteseMarshalleseMenomineeMexicanMexican American IndianMongolianMoroccanNative HawaiianNavajoNepaleseNew ZealanderNicaraguanNigerianNorthern EuropeanNorwegianOkinawanOsageOttawaPaiutePakistaniPalestinianPanamanianParaguayanPennsylvania GermanPeruvianPimaPolishPortuguesePotawatomiPuebloPuerto RicanPuget Sound SalishRomanianRussianSalvadoranSamoanScandinavianScotch-IrishScottishSeminoleSenegaleseSerbianShoshoneSierra LeoneanSiouxSlavicSlovakSloveneSomaliSouth AfricanSouth AmericanSouth American IndianSoviet UnionSpaniardSpanishSpanish AmericanSpanish American IndianSri LankanSubsaharan AfricanSudaneseSwedishSwissSyrianTaiwaneseThaiTlingit-HaidaTohono O'OdhamTonganTrinidadian and TobagonianTsimshianTurkishU.S. Virgin IslanderUgandanUkrainianUruguayanUteVenezuelanVietnameseWelshWest IndianYakamaYaquiYugoslavianYumanYup'ikZimbabwean
Immigration
NonimmigrantsImmigrantsAfghanistanAfricaAlbaniaArgentinaArmeniaAsiaAustraliaAustriaBahamasBangladeshBarbadosBelarusBelgiumBelizeBoliviaBosnia and HerzegovinaBrazilBulgariaBurma/MyanmarCabo VerdeCambodiaCameroonCanadaCaribbeanCentral AmericaChileChinaColombiaCongoCosta RicaCroatiaCubaCzechoslovakiaDenmarkDominicaDominican RepublicEastern AfricaEastern AsiaEastern EuropeEcuadorEgyptEl SalvadorEnglandEritreaEthiopiaEuropeFijiFranceGermanyGhanaGreeceGrenadaGuatemalaGuyanaHaitiHondurasHong KongHungaryIndiaIndonesiaIranIraqIrelandIsraelItalyJamaicaJapanJordanKazakhstanKenyaKoreaKuwaitLaosLatin AmericaLatviaLebanonLiberiaLithuaniaMalaysiaMexicoMicronesiaMiddle AfricaMoldovaMoroccoNepalNetherlandsNicaraguaNigeriaNorth MacedoniaNorthern AfricaNorthern EuropeNorwayOceaniaPakistanPanamaPeruPhilippinesPolandPortugalRomaniaRussiaSaudi ArabiaScotlandSenegalSerbiaSierra LeoneSingaporeSomaliaSouth AfricaSouth AmericaSouth Central AsiaSouth Eastern AsiaSouthern EuropeSpainSri LankaSt. Vincent and the GrenadinesSudanSwedenSwitzerlandSyriaTaiwanThailandTrinidad and TobagoTurkeyUgandaUkraineUruguayUzbekistanVenezuelaVietnamWest IndiesWestern AfricaWestern AsiaWestern EuropeYemenZaireZimbabweAzores
1 or more Vehicles in Household
Income
Poverty
Unemployment
Labor Participation
Family Structure
Vehicle Availability
Education Level
Disability

Immigrants from North America 1 or more Vehicles in Household
Exceptional

91.4%
1+ VEHICLES AVAILABLE
99.2/ 100
METRIC RATING
93rd/ 347
METRIC RANK

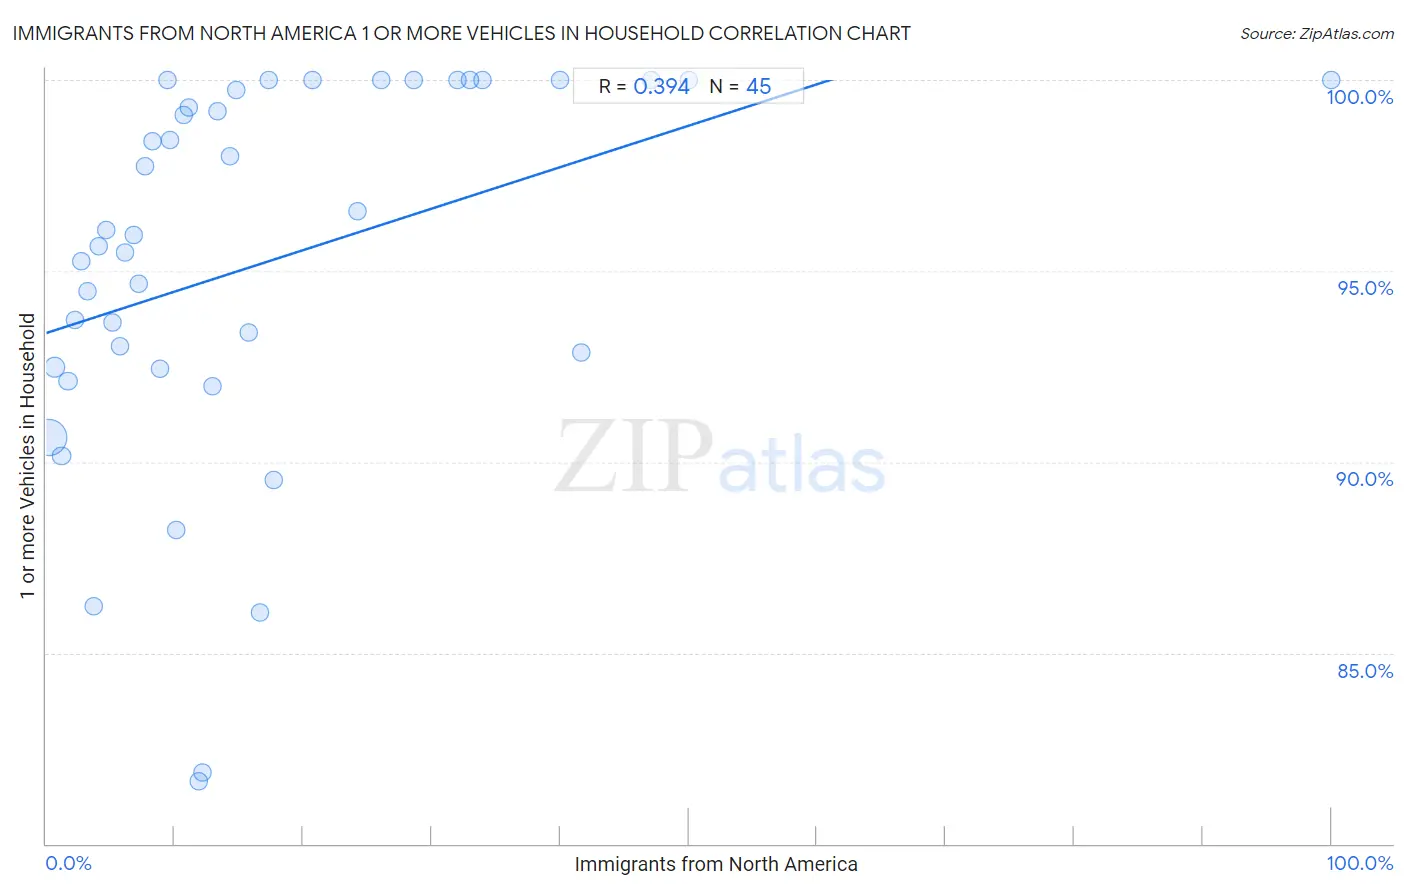
Immigrants from North America 1 or more Vehicles in Household Correlation Chart

The statistical analysis conducted on geographies consisting of 462,241,912 people shows a mild positive correlation between the proportion of Immigrants from North America and percentage of households with 1 or more vehicles available in the United States with a correlation coefficient (R) of 0.394 and weighted average of 91.4%. On average, for every 1% (one percent) increase in Immigrants from North America within a typical geography, there is an increase of 0.11% in percentage of households with 1 or more vehicles available.
Immigrants from North America 1 or more Vehicles in Household
It is essential to understand that the correlation between the percentage of Immigrants from North America and percentage of households with 1 or more vehicles available does not imply a direct cause-and-effect relationship. It remains uncertain whether the presence of Immigrants from North America influences an upward or downward trend in the level of percentage of households with 1 or more vehicles available within an area, or if Immigrants from North America simply ended up residing in those areas with higher or lower levels of percentage of households with 1 or more vehicles available due to other factors.

Demographics Similar to Immigrants from North America by 1 or more Vehicles in Household

In terms of 1 or more vehicles in household, the demographic groups most similar to Immigrants from North America are Bhutanese (91.4%, a difference of 0.0%), Spanish American (91.4%, a difference of 0.010%), Bangladeshi (91.4%, a difference of 0.010%), Immigrants from Canada (91.4%, a difference of 0.010%), and Immigrants from Jordan (91.4%, a difference of 0.010%).
DemographicsRating | Rank1 or more Vehicles in Household
Osage
99.2
/100
|
#86
Exceptional
91.4%
Immigrants from Germany
99.2
/100
|
#87
Exceptional
91.4%
Spanish Americans
99.2
/100
|
#88
Exceptional
91.4%
Bangladeshis
99.2
/100
|
#89
Exceptional
91.4%
Immigrants from Canada
99.2
/100
|
#90
Exceptional
91.4%
Immigrants from Jordan
99.2
/100
|
#91
Exceptional
91.4%
Bhutanese
99.2
/100
|
#92
Exceptional
91.4%
Immigrants from North America
99.2
/100
|
#93
Exceptional
91.4%
Immigrants from Cuba
99.1
/100
|
#94
Exceptional
91.3%
Austrians
99.0
/100
|
#95
Exceptional
91.3%
Potawatomi
99.0
/100
|
#96
Exceptional
91.3%
Pakistanis
99.0
/100
|
#97
Exceptional
91.3%
Slavs
98.7
/100
|
#98
Exceptional
91.2%
Immigrants from Bolivia
98.6
/100
|
#99
Exceptional
91.2%
Immigrants from Central America
98.4
/100
|
#100
Exceptional
91.1%

Immigrants from North America 1 or more Vehicles in Household Correlation Summary

MeasurementImmigrants from North America Data1 or more Vehicles in Household Data
Minimum0.19%81.6%
Maximum100.0%100.0%
Range99.8%18.4%
Mean16.8%95.2%
Median11.1%95.9%
Interquartile 25% (IQ1)5.5%92.5%
Interquartile 75% (IQ3)22.5%100.0%
Interquartile Range (IQR)17.0%7.5%
Standard Deviation (Sample)18.1%5.0%
Standard Deviation (Population)17.9%4.9%

Correlation Details

Immigrants from North America PercentileSample Size1 or more Vehicles in Household
[
0.0%
-
0.5%
]
0.19%
379,722,73390.6%
[
0.5%
-
1.0%
]
0.68%
61,153,98292.5%
[
1.0%
-
1.5%
]
1.20%
13,797,64690.2%
[
1.5%
-
2.0%
]
1.70%
4,622,08892.1%
[
2.0%
-
2.5%
]
2.21%
1,497,92493.7%
[
2.5%
-
3.0%
]
2.72%
667,22195.3%
[
3.0%
-
3.5%
]
3.22%
209,27194.5%
[
3.5%
-
4.0%
]
3.69%
150,31486.2%
[
4.0%
-
4.5%
]
4.13%
157,88195.6%
[
4.5%
-
5.0%
]
4.71%
47,69696.1%
[
5.0%
-
5.5%
]
5.15%
49,86493.6%
[
5.5%
-
6.0%
]
5.76%
20,78393.0%
[
6.0%
-
6.5%
]
6.15%
33,41495.5%
[
6.5%
-
7.0%
]
6.81%
17,46495.9%
[
7.0%
-
7.5%
]
7.20%
32,52094.7%
[
7.5%
-
8.0%
]
7.67%
14,90797.7%
[
8.0%
-
8.5%
]
8.25%
2,11098.4%
[
8.5%
-
9.0%
]
8.82%
5,59292.4%
[
9.0%
-
9.5%
]
9.44%
6,899100.0%
[
9.5%
-
10.0%
]
9.59%
2,38798.4%
[
10.0%
-
10.5%
]
10.11%
2,38388.2%
[
10.5%
-
11.0%
]
10.69%
2,46999.1%
[
11.0%
-
11.5%
]
11.11%
22599.3%
[
11.5%
-
12.0%
]
11.87%
5,27581.6%
[
12.0%
-
12.5%
]
12.20%
3,15681.9%
[
12.5%
-
13.0%
]
12.93%
82092.0%
[
13.0%
-
13.5%
]
13.30%
20399.2%
[
14.0%
-
14.5%
]
14.34%
1,29098.0%
[
14.5%
-
15.0%
]
14.74%
1,32399.8%
[
15.5%
-
16.0%
]
15.79%
24793.4%
[
16.5%
-
17.0%
]
16.59%
4,29786.0%
[
17.0%
-
17.5%
]
17.29%
133100.0%
[
17.5%
-
18.0%
]
17.74%
3,90789.5%
[
20.5%
-
21.0%
]
20.70%
401100.0%
[
24.0%
-
24.5%
]
24.26%
2,49896.6%
[
26.0%
-
26.5%
]
26.09%
23100.0%
[
28.5%
-
29.0%
]
28.57%
56100.0%
[
32.0%
-
32.5%
]
32.05%
156100.0%
[
33.0%
-
33.5%
]
33.00%
200100.0%
[
33.5%
-
34.0%
]
33.93%
56100.0%
[
40.0%
-
40.5%
]
40.00%
50100.0%
[
41.5%
-
42.0%
]
41.67%
2492.9%
[
47.0%
-
47.5%
]
47.06%
17100.0%
[
50.0%
-
50.5%
]
50.00%
4100.0%
[
99.5%
-
100.0%
]
100.00%
3100.0%