Immigrants from North America Wage/Income Gap
COMPARE
Immigrants from North America
Select to Compare
Wage/Income Gap
Immigrants from North America Wage/Income Gap
28.4%
WAGE/INCOME GAP
0.2/ 100
METRIC RATING
297th/ 347
METRIC RANK
Immigrants from North America Wage/Income Gap Correlation Chart
The statistical analysis conducted on geographies consisting of 461,849,295 people shows a poor positive correlation between the proportion of Immigrants from North America and wage/income gap percentage in the United States with a correlation coefficient (R) of 0.173 and weighted average of 28.4%. On average, for every 1% (one percent) increase in Immigrants from North America within a typical geography, there is an increase of 0.34% in wage/income gap percentage.
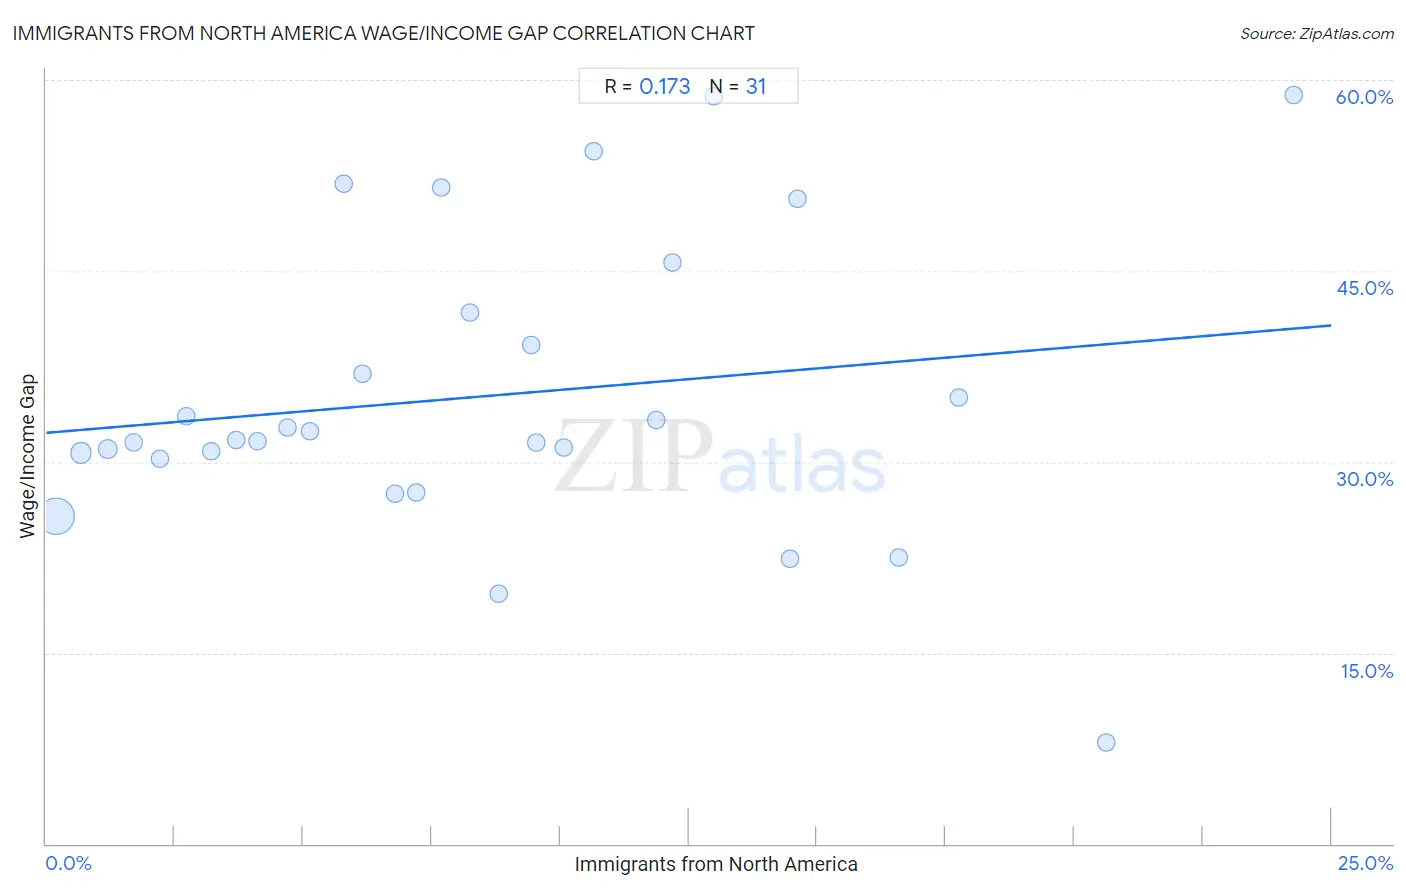
It is essential to understand that the correlation between the percentage of Immigrants from North America and wage/income gap percentage does not imply a direct cause-and-effect relationship. It remains uncertain whether the presence of Immigrants from North America influences an upward or downward trend in the level of wage/income gap percentage within an area, or if Immigrants from North America simply ended up residing in those areas with higher or lower levels of wage/income gap percentage due to other factors.
Demographics Similar to Immigrants from North America by Wage/Income Gap
In terms of wage/income gap, the demographic groups most similar to Immigrants from North America are Austrian (28.4%, a difference of 0.0%), Immigrants from North Macedonia (28.4%, a difference of 0.050%), Immigrants from Northern Europe (28.5%, a difference of 0.17%), Immigrants from Canada (28.5%, a difference of 0.21%), and Scotch-Irish (28.5%, a difference of 0.24%).
| Demographics | Rating | Rank | Wage/Income Gap |
| Australians | 0.3 /100 | #290 | Tragic 28.2% |
| Czechoslovakians | 0.3 /100 | #291 | Tragic 28.2% |
| Immigrants from Australia | 0.3 /100 | #292 | Tragic 28.2% |
| Immigrants from Israel | 0.3 /100 | #293 | Tragic 28.2% |
| Greeks | 0.3 /100 | #294 | Tragic 28.2% |
| Slovenes | 0.3 /100 | #295 | Tragic 28.3% |
| Northern Europeans | 0.3 /100 | #296 | Tragic 28.3% |
| Immigrants from North America | 0.2 /100 | #297 | Tragic 28.4% |
| Austrians | 0.2 /100 | #298 | Tragic 28.4% |
| Immigrants from North Macedonia | 0.2 /100 | #299 | Tragic 28.4% |
| Immigrants from Northern Europe | 0.2 /100 | #300 | Tragic 28.5% |
| Immigrants from Canada | 0.2 /100 | #301 | Tragic 28.5% |
| Scotch-Irish | 0.2 /100 | #302 | Tragic 28.5% |
| Irish | 0.2 /100 | #303 | Tragic 28.5% |
| Immigrants from Netherlands | 0.2 /100 | #304 | Tragic 28.5% |
Immigrants from North America Wage/Income Gap Correlation Summary
| Measurement | Immigrants from North America Data | Wage/Income Gap Data |
| Minimum | 0.19% | 8.0% |
| Maximum | 24.3% | 58.9% |
| Range | 24.1% | 50.9% |
| Mean | 8.6% | 35.2% |
| Median | 7.7% | 31.8% |
| Interquartile 25% (IQ1) | 3.7% | 30.2% |
| Interquartile 75% (IQ3) | 12.2% | 41.7% |
| Interquartile Range (IQR) | 8.5% | 11.5% |
| Standard Deviation (Sample) | 6.0% | 11.7% |
| Standard Deviation (Population) | 5.9% | 11.5% |
Correlation Details
| Immigrants from North America Percentile | Sample Size | Wage/Income Gap |
[ 0.0% - 0.5% ] 0.19% | 379,684,855 | 25.8% |
[ 0.5% - 1.0% ] 0.68% | 61,069,091 | 30.7% |
[ 1.0% - 1.5% ] 1.20% | 13,688,660 | 31.0% |
[ 1.5% - 2.0% ] 1.69% | 4,577,482 | 31.5% |
[ 2.0% - 2.5% ] 2.21% | 1,481,812 | 30.2% |
[ 2.5% - 3.0% ] 2.72% | 646,003 | 33.6% |
[ 3.0% - 3.5% ] 3.22% | 196,306 | 30.8% |
[ 3.5% - 4.0% ] 3.69% | 137,994 | 31.8% |
[ 4.0% - 4.5% ] 4.12% | 151,035 | 31.6% |
[ 4.5% - 5.0% ] 4.69% | 40,402 | 32.7% |
[ 5.0% - 5.5% ] 5.14% | 42,172 | 32.4% |
[ 5.5% - 6.0% ] 5.78% | 13,993 | 51.9% |
[ 6.0% - 6.5% ] 6.14% | 25,466 | 36.9% |
[ 6.5% - 7.0% ] 6.78% | 12,909 | 27.5% |
[ 7.0% - 7.5% ] 7.19% | 30,592 | 27.6% |
[ 7.5% - 8.0% ] 7.68% | 13,404 | 51.5% |
[ 8.0% - 8.5% ] 8.25% | 2,000 | 41.7% |
[ 8.5% - 9.0% ] 8.81% | 3,688 | 19.6% |
[ 9.0% - 9.5% ] 9.44% | 6,738 | 39.1% |
[ 9.5% - 10.0% ] 9.54% | 1,383 | 31.5% |
[ 10.0% - 10.5% ] 10.08% | 2,004 | 31.1% |
[ 10.5% - 11.0% ] 10.65% | 1,136 | 54.4% |
[ 11.5% - 12.0% ] 11.87% | 4,935 | 33.3% |
[ 12.0% - 12.5% ] 12.18% | 2,726 | 45.7% |
[ 12.5% - 13.0% ] 12.99% | 639 | 58.8% |
[ 14.0% - 14.5% ] 14.46% | 726 | 22.4% |
[ 14.5% - 15.0% ] 14.62% | 390 | 50.7% |
[ 16.5% - 17.0% ] 16.59% | 4,297 | 22.5% |
[ 17.5% - 18.0% ] 17.74% | 3,799 | 35.1% |
[ 20.5% - 21.0% ] 20.62% | 160 | 8.0% |
[ 24.0% - 24.5% ] 24.26% | 2,498 | 58.9% |