Immigrants from North America Married-couple Households
COMPARE
Immigrants from North America
Select to Compare
Married-couple Households
Immigrants from North America Married-couple Households
48.4%
MARRIED-COUPLE HOUSEHOLDS
98.9/ 100
METRIC RATING
70th/ 347
METRIC RANK
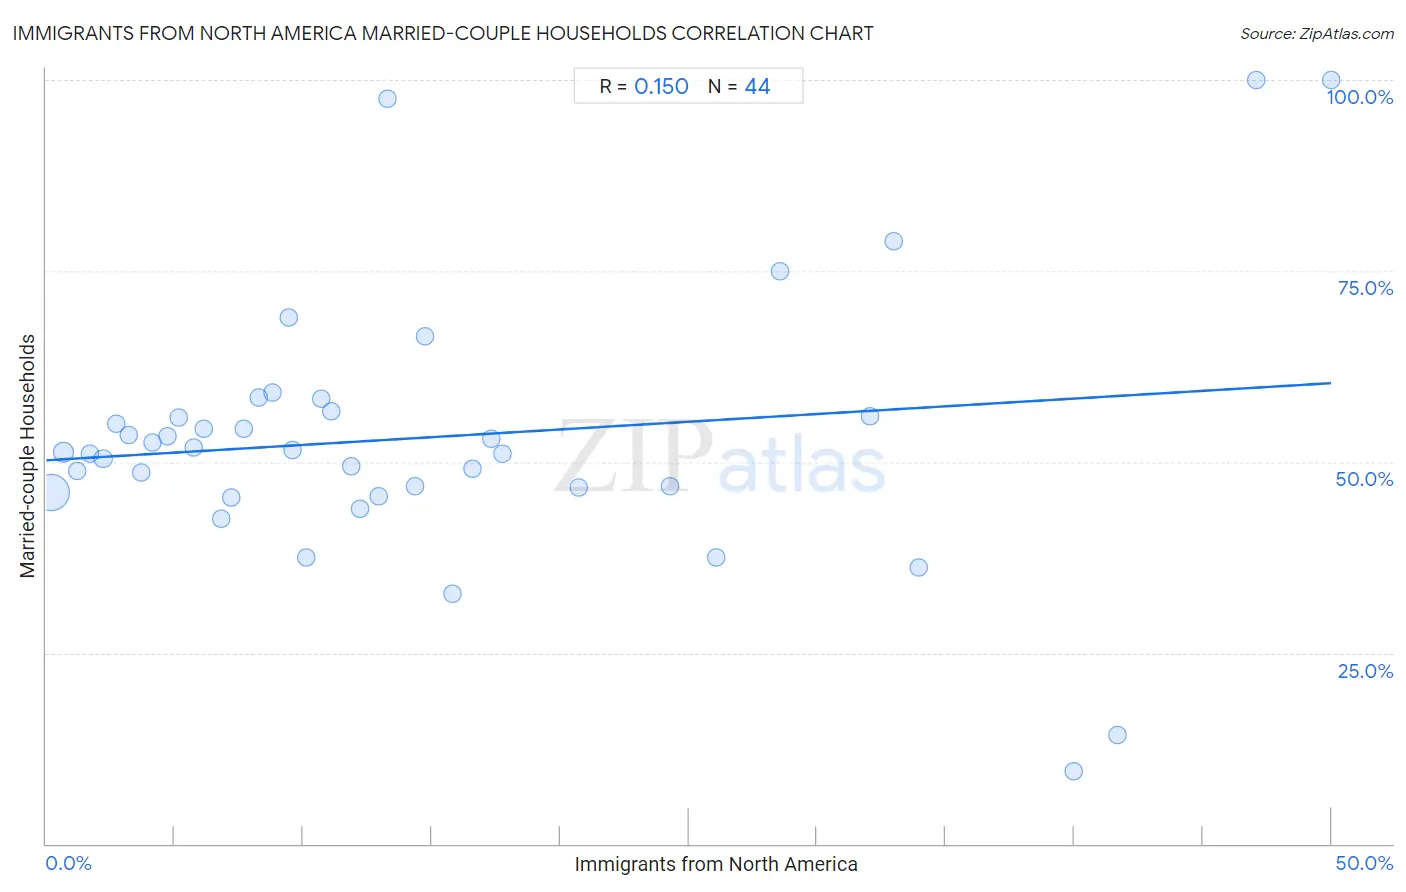
Immigrants from North America Married-couple Households Correlation Chart
The statistical analysis conducted on geographies consisting of 462,174,767 people shows a poor positive correlation between the proportion of Immigrants from North America and percentage of married-couple family households in the United States with a correlation coefficient (R) of 0.150 and weighted average of 48.4%. On average, for every 1% (one percent) increase in Immigrants from North America within a typical geography, there is an increase of 0.20% in percentage of married-couple family households.
It is essential to understand that the correlation between the percentage of Immigrants from North America and percentage of married-couple family households does not imply a direct cause-and-effect relationship. It remains uncertain whether the presence of Immigrants from North America influences an upward or downward trend in the level of percentage of married-couple family households within an area, or if Immigrants from North America simply ended up residing in those areas with higher or lower levels of percentage of married-couple family households due to other factors.
Demographics Similar to Immigrants from North America by Married-couple Households
In terms of married-couple households, the demographic groups most similar to Immigrants from North America are Laotian (48.4%, a difference of 0.010%), Immigrants from South Eastern Asia (48.4%, a difference of 0.040%), Immigrants from China (48.4%, a difference of 0.040%), Jordanian (48.4%, a difference of 0.060%), and Romanian (48.4%, a difference of 0.060%).
| Demographics | Rating | Rank | Married-couple Households |
| Basques | 99.0 /100 | #63 | Exceptional 48.4% |
| Northern Europeans | 99.0 /100 | #64 | Exceptional 48.4% |
| Immigrants from Canada | 99.0 /100 | #65 | Exceptional 48.4% |
| Jordanians | 98.9 /100 | #66 | Exceptional 48.4% |
| Romanians | 98.9 /100 | #67 | Exceptional 48.4% |
| Immigrants from South Eastern Asia | 98.9 /100 | #68 | Exceptional 48.4% |
| Immigrants from China | 98.9 /100 | #69 | Exceptional 48.4% |
| Immigrants from North America | 98.9 /100 | #70 | Exceptional 48.4% |
| Laotians | 98.8 /100 | #71 | Exceptional 48.4% |
| Scotch-Irish | 98.6 /100 | #72 | Exceptional 48.3% |
| Immigrants from Singapore | 98.6 /100 | #73 | Exceptional 48.3% |
| Immigrants from Romania | 98.6 /100 | #74 | Exceptional 48.3% |
| Immigrants from England | 98.4 /100 | #75 | Exceptional 48.2% |
| Immigrants from Fiji | 98.4 /100 | #76 | Exceptional 48.2% |
| Canadians | 98.2 /100 | #77 | Exceptional 48.2% |
Immigrants from North America Married-couple Households Correlation Summary
| Measurement | Immigrants from North America Data | Married-couple Households Data |
| Minimum | 0.19% | 9.5% |
| Maximum | 50.0% | 100.0% |
| Range | 49.8% | 90.5% |
| Mean | 14.9% | 53.2% |
| Median | 10.9% | 51.3% |
| Interquartile 25% (IQ1) | 5.5% | 46.3% |
| Interquartile 75% (IQ3) | 19.2% | 56.3% |
| Interquartile Range (IQR) | 13.8% | 10.0% |
| Standard Deviation (Sample) | 13.0% | 17.6% |
| Standard Deviation (Population) | 12.9% | 17.3% |
Correlation Details
| Immigrants from North America Percentile | Sample Size | Married-couple Households |
[ 0.0% - 0.5% ] 0.19% | 379,671,387 | 46.0% |
[ 0.5% - 1.0% ] 0.68% | 61,148,209 | 51.2% |
[ 1.0% - 1.5% ] 1.20% | 13,790,383 | 48.8% |
[ 1.5% - 2.0% ] 1.70% | 4,619,229 | 51.1% |
[ 2.0% - 2.5% ] 2.21% | 1,497,924 | 50.4% |
[ 2.5% - 3.0% ] 2.72% | 667,050 | 54.9% |
[ 3.0% - 3.5% ] 3.22% | 209,271 | 53.6% |
[ 3.5% - 4.0% ] 3.69% | 150,314 | 48.6% |
[ 4.0% - 4.5% ] 4.13% | 158,000 | 52.5% |
[ 4.5% - 5.0% ] 4.71% | 47,758 | 53.3% |
[ 5.0% - 5.5% ] 5.15% | 49,864 | 55.7% |
[ 5.5% - 6.0% ] 5.76% | 20,783 | 51.9% |
[ 6.0% - 6.5% ] 6.15% | 33,414 | 54.4% |
[ 6.5% - 7.0% ] 6.81% | 17,464 | 42.6% |
[ 7.0% - 7.5% ] 7.20% | 32,520 | 45.4% |
[ 7.5% - 8.0% ] 7.68% | 14,996 | 54.4% |
[ 8.0% - 8.5% ] 8.25% | 2,110 | 58.4% |
[ 8.5% - 9.0% ] 8.82% | 5,592 | 59.2% |
[ 9.0% - 9.5% ] 9.44% | 6,899 | 68.9% |
[ 9.5% - 10.0% ] 9.59% | 2,387 | 51.5% |
[ 10.0% - 10.5% ] 10.11% | 2,383 | 37.5% |
[ 10.5% - 11.0% ] 10.69% | 2,469 | 58.3% |
[ 11.0% - 11.5% ] 11.11% | 225 | 56.6% |
[ 11.5% - 12.0% ] 11.87% | 5,275 | 49.5% |
[ 12.0% - 12.5% ] 12.20% | 3,156 | 43.9% |
[ 12.5% - 13.0% ] 12.93% | 820 | 45.5% |
[ 13.0% - 13.5% ] 13.30% | 203 | 97.5% |
[ 14.0% - 14.5% ] 14.34% | 1,290 | 46.7% |
[ 14.5% - 15.0% ] 14.74% | 1,323 | 66.5% |
[ 15.5% - 16.0% ] 15.79% | 247 | 32.7% |
[ 16.5% - 17.0% ] 16.59% | 4,297 | 49.1% |
[ 17.0% - 17.5% ] 17.29% | 133 | 53.1% |
[ 17.5% - 18.0% ] 17.74% | 3,907 | 51.1% |
[ 20.5% - 21.0% ] 20.70% | 401 | 46.7% |
[ 24.0% - 24.5% ] 24.26% | 2,498 | 46.9% |
[ 26.0% - 26.5% ] 26.09% | 23 | 37.5% |
[ 28.5% - 29.0% ] 28.57% | 56 | 75.0% |
[ 32.0% - 32.5% ] 32.05% | 156 | 56.0% |
[ 33.0% - 33.5% ] 33.00% | 200 | 78.8% |
[ 33.5% - 34.0% ] 33.93% | 56 | 36.1% |
[ 40.0% - 40.5% ] 40.00% | 50 | 9.5% |
[ 41.5% - 42.0% ] 41.67% | 24 | 14.3% |
[ 47.0% - 47.5% ] 47.06% | 17 | 100.0% |
[ 50.0% - 50.5% ] 50.00% | 4 | 100.0% |