Immigrants from Cambodia GED/Equivalency

COMPARE

Immigrants from Cambodia
Race
Ancestry
AfghanAfricanAlaska NativeAlaskan AthabascanAlbanianAleutAlsatianAmericanApacheArabArapahoArgentineanArmenianAssyrian/Chaldean/SyriacAustralianAustrianBahamianBangladeshiBarbadianBasqueBelgianBelizeanBermudanBhutaneseBlackfeetBolivianBrazilianBritishBritish West IndianBulgarianBurmeseCajunCambodianCanadianCape VerdeanCarpatho RusynCelticCentral AmericanCentral American IndianCherokeeCheyenneChickasawChileanChineseChippewaChoctawColombianColvilleComancheCosta RicanCreeCreekCroatianCrowCubanCypriotCzechCzechoslovakianDanishDelawareDominicanDutchDutch West IndianEastern EuropeanEcuadorianEgyptianEnglishEstonianEthiopianEuropeanFijianFilipinoFinnishFrenchFrench American IndianFrench CanadianGermanGerman RussianGhanaianGreekGuamanian/ChamorroGuatemalanGuyaneseHaitianHmongHonduranHopiHoumaHungarianIcelanderIndian (Asian)IndonesianInupiatIranianIraqiIrishIroquoisIsraeliItalianJamaicanJapaneseJordanianKenyanKiowaKoreanLaotianLatvianLebaneseLiberianLithuanianLumbeeLuxembourgerMacedonianMalaysianMalteseMarshalleseMenomineeMexicanMexican American IndianMongolianMoroccanNative HawaiianNavajoNepaleseNew ZealanderNicaraguanNigerianNorthern EuropeanNorwegianOkinawanOsageOttawaPaiutePakistaniPalestinianPanamanianParaguayanPennsylvania GermanPeruvianPimaPolishPortuguesePotawatomiPuebloPuerto RicanPuget Sound SalishRomanianRussianSalvadoranSamoanScandinavianScotch-IrishScottishSeminoleSenegaleseSerbianShoshoneSierra LeoneanSiouxSlavicSlovakSloveneSomaliSouth AfricanSouth AmericanSouth American IndianSoviet UnionSpaniardSpanishSpanish AmericanSpanish American IndianSri LankanSubsaharan AfricanSudaneseSwedishSwissSyrianTaiwaneseThaiTlingit-HaidaTohono O'OdhamTonganTrinidadian and TobagonianTsimshianTurkishU.S. Virgin IslanderUgandanUkrainianUruguayanUteVenezuelanVietnameseWelshWest IndianYakamaYaquiYugoslavianYumanYup'ikZimbabwean
Immigration
NonimmigrantsImmigrantsAfghanistanAfricaAlbaniaArgentinaArmeniaAsiaAustraliaAustriaBahamasBangladeshBarbadosBelarusBelgiumBelizeBoliviaBosnia and HerzegovinaBrazilBulgariaBurma/MyanmarCabo VerdeCambodiaCameroonCanadaCaribbeanCentral AmericaChileChinaColombiaCongoCosta RicaCroatiaCubaCzechoslovakiaDenmarkDominicaDominican RepublicEastern AfricaEastern AsiaEastern EuropeEcuadorEgyptEl SalvadorEnglandEritreaEthiopiaEuropeFijiFranceGermanyGhanaGreeceGrenadaGuatemalaGuyanaHaitiHondurasHong KongHungaryIndiaIndonesiaIranIraqIrelandIsraelItalyJamaicaJapanJordanKazakhstanKenyaKoreaKuwaitLaosLatin AmericaLatviaLebanonLiberiaLithuaniaMalaysiaMexicoMicronesiaMiddle AfricaMoldovaMoroccoNepalNetherlandsNicaraguaNigeriaNorth AmericaNorth MacedoniaNorthern AfricaNorthern EuropeNorwayOceaniaPakistanPanamaPeruPhilippinesPolandPortugalRomaniaRussiaSaudi ArabiaScotlandSenegalSerbiaSierra LeoneSingaporeSomaliaSouth AfricaSouth AmericaSouth Central AsiaSouth Eastern AsiaSouthern EuropeSpainSri LankaSt. Vincent and the GrenadinesSudanSwedenSwitzerlandSyriaTaiwanThailandTrinidad and TobagoTurkeyUgandaUkraineUruguayUzbekistanVenezuelaVietnamWest IndiesWestern AfricaWestern AsiaWestern EuropeYemenZaireZimbabweAzores
Select to Compare
Race
Ancestry
AfghanAfricanAlaska NativeAlaskan AthabascanAlbanianAleutAlsatianAmericanApacheArabArapahoArgentineanArmenianAssyrian/Chaldean/SyriacAustralianAustrianBahamianBangladeshiBarbadianBasqueBelgianBelizeanBermudanBhutaneseBlackfeetBolivianBrazilianBritishBritish West IndianBulgarianBurmeseCajunCambodianCanadianCape VerdeanCarpatho RusynCelticCentral AmericanCentral American IndianCherokeeCheyenneChickasawChileanChineseChippewaChoctawColombianColvilleComancheCosta RicanCreeCreekCroatianCrowCubanCypriotCzechCzechoslovakianDanishDelawareDominicanDutchDutch West IndianEastern EuropeanEcuadorianEgyptianEnglishEstonianEthiopianEuropeanFijianFilipinoFinnishFrenchFrench American IndianFrench CanadianGermanGerman RussianGhanaianGreekGuamanian/ChamorroGuatemalanGuyaneseHaitianHmongHonduranHopiHoumaHungarianIcelanderIndian (Asian)IndonesianInupiatIranianIraqiIrishIroquoisIsraeliItalianJamaicanJapaneseJordanianKenyanKiowaKoreanLaotianLatvianLebaneseLiberianLithuanianLumbeeLuxembourgerMacedonianMalaysianMalteseMarshalleseMenomineeMexicanMexican American IndianMongolianMoroccanNative HawaiianNavajoNepaleseNew ZealanderNicaraguanNigerianNorthern EuropeanNorwegianOkinawanOsageOttawaPaiutePakistaniPalestinianPanamanianParaguayanPennsylvania GermanPeruvianPimaPolishPortuguesePotawatomiPuebloPuerto RicanPuget Sound SalishRomanianRussianSalvadoranSamoanScandinavianScotch-IrishScottishSeminoleSenegaleseSerbianShoshoneSierra LeoneanSiouxSlavicSlovakSloveneSomaliSouth AfricanSouth AmericanSouth American IndianSoviet UnionSpaniardSpanishSpanish AmericanSpanish American IndianSri LankanSubsaharan AfricanSudaneseSwedishSwissSyrianTaiwaneseThaiTlingit-HaidaTohono O'OdhamTonganTrinidadian and TobagonianTsimshianTurkishU.S. Virgin IslanderUgandanUkrainianUruguayanUteVenezuelanVietnameseWelshWest IndianYakamaYaquiYugoslavianYumanYup'ikZimbabwean
Immigration
NonimmigrantsImmigrantsAfghanistanAfricaAlbaniaArgentinaArmeniaAsiaAustraliaAustriaBahamasBangladeshBarbadosBelarusBelgiumBelizeBoliviaBosnia and HerzegovinaBrazilBulgariaBurma/MyanmarCabo VerdeCameroonCanadaCaribbeanCentral AmericaChileChinaColombiaCongoCosta RicaCroatiaCubaCzechoslovakiaDenmarkDominicaDominican RepublicEastern AfricaEastern AsiaEastern EuropeEcuadorEgyptEl SalvadorEnglandEritreaEthiopiaEuropeFijiFranceGermanyGhanaGreeceGrenadaGuatemalaGuyanaHaitiHondurasHong KongHungaryIndiaIndonesiaIranIraqIrelandIsraelItalyJamaicaJapanJordanKazakhstanKenyaKoreaKuwaitLaosLatin AmericaLatviaLebanonLiberiaLithuaniaMalaysiaMexicoMicronesiaMiddle AfricaMoldovaMoroccoNepalNetherlandsNicaraguaNigeriaNorth AmericaNorth MacedoniaNorthern AfricaNorthern EuropeNorwayOceaniaPakistanPanamaPeruPhilippinesPolandPortugalRomaniaRussiaSaudi ArabiaScotlandSenegalSerbiaSierra LeoneSingaporeSomaliaSouth AfricaSouth AmericaSouth Central AsiaSouth Eastern AsiaSouthern EuropeSpainSri LankaSt. Vincent and the GrenadinesSudanSwedenSwitzerlandSyriaTaiwanThailandTrinidad and TobagoTurkeyUgandaUkraineUruguayUzbekistanVenezuelaVietnamWest IndiesWestern AfricaWestern AsiaWestern EuropeYemenZaireZimbabweAzores
GED/Equivalency
Income
Poverty
Unemployment
Labor Participation
Family Structure
Vehicle Availability
Education Level
Disability

Immigrants from Cambodia GED/Equivalency
Tragic

82.2%
GED/EQUIVALENCY
0.0/ 100
METRIC RATING
289th/ 347
METRIC RANK

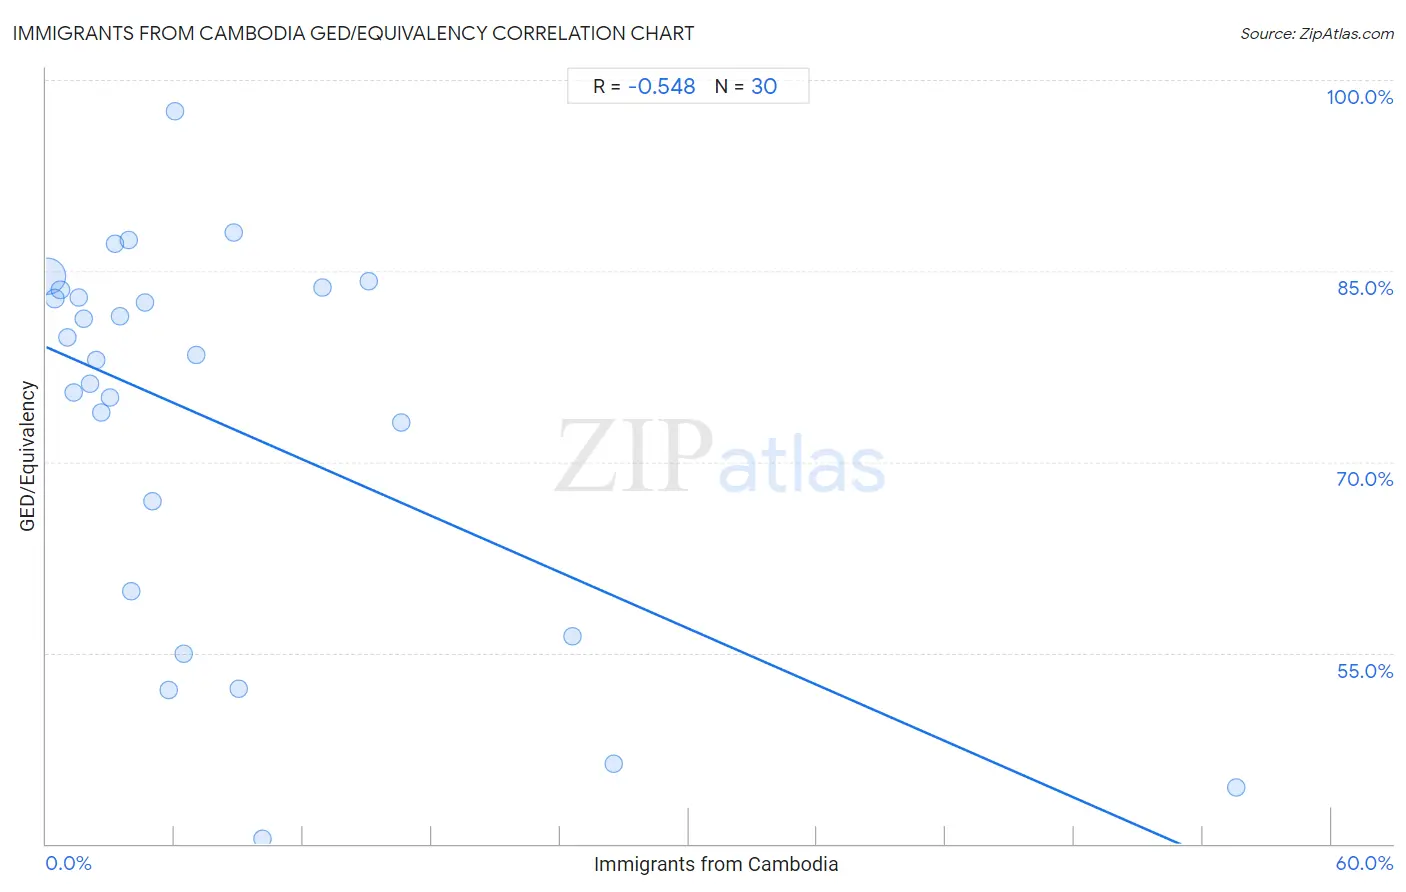
Immigrants from Cambodia GED/Equivalency Correlation Chart

The statistical analysis conducted on geographies consisting of 205,153,442 people shows a substantial negative correlation between the proportion of Immigrants from Cambodia and percentage of population with at least ged/equivalency education in the United States with a correlation coefficient (R) of -0.548 and weighted average of 82.2%. On average, for every 1% (one percent) increase in Immigrants from Cambodia within a typical geography, there is a decrease of 0.74% in percentage of population with at least ged/equivalency education.
Immigrants from Cambodia GED/Equivalency
It is essential to understand that the correlation between the percentage of Immigrants from Cambodia and percentage of population with at least ged/equivalency education does not imply a direct cause-and-effect relationship. It remains uncertain whether the presence of Immigrants from Cambodia influences an upward or downward trend in the level of percentage of population with at least ged/equivalency education within an area, or if Immigrants from Cambodia simply ended up residing in those areas with higher or lower levels of percentage of population with at least ged/equivalency education due to other factors.

Demographics Similar to Immigrants from Cambodia by GED/Equivalency

In terms of ged/equivalency, the demographic groups most similar to Immigrants from Cambodia are Pueblo (82.3%, a difference of 0.080%), Japanese (82.4%, a difference of 0.18%), Immigrants from West Indies (82.4%, a difference of 0.19%), Haitian (82.1%, a difference of 0.19%), and Cajun (82.4%, a difference of 0.22%).
DemographicsRating | RankGED/Equivalency
Immigrants
0.1
/100
|
#282
Tragic
82.6%
Indonesians
0.1
/100
|
#283
Tragic
82.5%
Immigrants from Barbados
0.1
/100
|
#284
Tragic
82.4%
Cajuns
0.0
/100
|
#285
Tragic
82.4%
Immigrants from West Indies
0.0
/100
|
#286
Tragic
82.4%
Japanese
0.0
/100
|
#287
Tragic
82.4%
Pueblo
0.0
/100
|
#288
Tragic
82.3%
Immigrants from Cambodia
0.0
/100
|
#289
Tragic
82.2%
Haitians
0.0
/100
|
#290
Tragic
82.1%
Cubans
0.0
/100
|
#291
Tragic
82.0%
Paiute
0.0
/100
|
#292
Tragic
82.0%
British West Indians
0.0
/100
|
#293
Tragic
82.0%
Immigrants from St. Vincent and the Grenadines
0.0
/100
|
#294
Tragic
82.0%
Nepalese
0.0
/100
|
#295
Tragic
81.9%
Vietnamese
0.0
/100
|
#296
Tragic
81.9%

Immigrants from Cambodia GED/Equivalency Correlation Summary

MeasurementImmigrants from Cambodia DataGED/Equivalency Data
Minimum0.067%40.4%
Maximum55.6%97.5%
Range55.5%57.1%
Mean8.2%73.0%
Median4.3%78.2%
Interquartile 25% (IQ1)2.0%59.8%
Interquartile 75% (IQ3)9.0%83.5%
Interquartile Range (IQR)7.0%23.7%
Standard Deviation (Sample)11.2%15.0%
Standard Deviation (Population)11.0%14.8%

Correlation Details

Immigrants from Cambodia PercentileSample SizeGED/Equivalency
[
0.0%
-
0.5%
]
0.067%
180,850,63984.6%
[
0.0%
-
0.5%
]
0.38%
16,212,49082.8%
[
0.5%
-
1.0%
]
0.67%
3,948,97683.5%
[
0.5%
-
1.0%
]
0.96%
1,720,38579.8%
[
1.0%
-
1.5%
]
1.30%
768,15075.5%
[
1.5%
-
2.0%
]
1.53%
229,16182.9%
[
1.5%
-
2.0%
]
1.76%
540,84481.3%
[
2.0%
-
2.5%
]
2.02%
176,23776.2%
[
2.0%
-
2.5%
]
2.36%
93,73878.0%
[
2.5%
-
3.0%
]
2.56%
178,95773.9%
[
2.5%
-
3.0%
]
2.95%
113,21775.0%
[
3.0%
-
3.5%
]
3.19%
3,17187.2%
[
3.0%
-
3.5%
]
3.43%
69,99581.4%
[
3.5%
-
4.0%
]
3.85%
28,19987.5%
[
3.5%
-
4.0%
]
3.95%
58,49459.8%
[
4.5%
-
5.0%
]
4.63%
2,13882.5%
[
4.5%
-
5.0%
]
4.99%
1,06366.9%
[
5.5%
-
6.0%
]
5.71%
3,57552.1%
[
6.0%
-
6.5%
]
6.03%
36597.5%
[
6.0%
-
6.5%
]
6.41%
2,21555.0%
[
7.0%
-
7.5%
]
7.00%
115,14878.4%
[
8.5%
-
9.0%
]
8.75%
56088.1%
[
9.0%
-
9.5%
]
9.02%
1,57552.1%
[
10.0%
-
10.5%
]
10.10%
92140.4%
[
12.5%
-
13.0%
]
12.88%
13283.7%
[
15.0%
-
15.5%
]
15.03%
32684.2%
[
16.5%
-
17.0%
]
16.60%
32,32373.1%
[
24.5%
-
25.0%
]
24.55%
22056.3%
[
26.0%
-
26.5%
]
26.48%
21946.3%
[
55.5%
-
56.0%
]
55.56%
944.4%