Immigrants from Cambodia 2 or more Vehicles in Household

COMPARE

Immigrants from Cambodia
Race
Ancestry
AfghanAfricanAlaska NativeAlaskan AthabascanAlbanianAleutAlsatianAmericanApacheArabArapahoArgentineanArmenianAssyrian/Chaldean/SyriacAustralianAustrianBahamianBangladeshiBarbadianBasqueBelgianBelizeanBermudanBhutaneseBlackfeetBolivianBrazilianBritishBritish West IndianBulgarianBurmeseCajunCambodianCanadianCape VerdeanCarpatho RusynCelticCentral AmericanCentral American IndianCherokeeCheyenneChickasawChileanChineseChippewaChoctawColombianColvilleComancheCosta RicanCreeCreekCroatianCrowCubanCypriotCzechCzechoslovakianDanishDelawareDominicanDutchDutch West IndianEastern EuropeanEcuadorianEgyptianEnglishEstonianEthiopianEuropeanFijianFilipinoFinnishFrenchFrench American IndianFrench CanadianGermanGerman RussianGhanaianGreekGuamanian/ChamorroGuatemalanGuyaneseHaitianHmongHonduranHopiHoumaHungarianIcelanderIndian (Asian)IndonesianInupiatIranianIraqiIrishIroquoisIsraeliItalianJamaicanJapaneseJordanianKenyanKiowaKoreanLaotianLatvianLebaneseLiberianLithuanianLumbeeLuxembourgerMacedonianMalaysianMalteseMarshalleseMenomineeMexicanMexican American IndianMongolianMoroccanNative HawaiianNavajoNepaleseNew ZealanderNicaraguanNigerianNorthern EuropeanNorwegianOkinawanOsageOttawaPaiutePakistaniPalestinianPanamanianParaguayanPennsylvania GermanPeruvianPimaPolishPortuguesePotawatomiPuebloPuerto RicanPuget Sound SalishRomanianRussianSalvadoranSamoanScandinavianScotch-IrishScottishSeminoleSenegaleseSerbianShoshoneSierra LeoneanSiouxSlavicSlovakSloveneSomaliSouth AfricanSouth AmericanSouth American IndianSoviet UnionSpaniardSpanishSpanish AmericanSpanish American IndianSri LankanSubsaharan AfricanSudaneseSwedishSwissSyrianTaiwaneseThaiTlingit-HaidaTohono O'OdhamTonganTrinidadian and TobagonianTsimshianTurkishU.S. Virgin IslanderUgandanUkrainianUruguayanUteVenezuelanVietnameseWelshWest IndianYakamaYaquiYugoslavianYumanYup'ikZimbabwean
Immigration
NonimmigrantsImmigrantsAfghanistanAfricaAlbaniaArgentinaArmeniaAsiaAustraliaAustriaBahamasBangladeshBarbadosBelarusBelgiumBelizeBoliviaBosnia and HerzegovinaBrazilBulgariaBurma/MyanmarCabo VerdeCambodiaCameroonCanadaCaribbeanCentral AmericaChileChinaColombiaCongoCosta RicaCroatiaCubaCzechoslovakiaDenmarkDominicaDominican RepublicEastern AfricaEastern AsiaEastern EuropeEcuadorEgyptEl SalvadorEnglandEritreaEthiopiaEuropeFijiFranceGermanyGhanaGreeceGrenadaGuatemalaGuyanaHaitiHondurasHong KongHungaryIndiaIndonesiaIranIraqIrelandIsraelItalyJamaicaJapanJordanKazakhstanKenyaKoreaKuwaitLaosLatin AmericaLatviaLebanonLiberiaLithuaniaMalaysiaMexicoMicronesiaMiddle AfricaMoldovaMoroccoNepalNetherlandsNicaraguaNigeriaNorth AmericaNorth MacedoniaNorthern AfricaNorthern EuropeNorwayOceaniaPakistanPanamaPeruPhilippinesPolandPortugalRomaniaRussiaSaudi ArabiaScotlandSenegalSerbiaSierra LeoneSingaporeSomaliaSouth AfricaSouth AmericaSouth Central AsiaSouth Eastern AsiaSouthern EuropeSpainSri LankaSt. Vincent and the GrenadinesSudanSwedenSwitzerlandSyriaTaiwanThailandTrinidad and TobagoTurkeyUgandaUkraineUruguayUzbekistanVenezuelaVietnamWest IndiesWestern AfricaWestern AsiaWestern EuropeYemenZaireZimbabweAzores
Select to Compare
Race
Ancestry
AfghanAfricanAlaska NativeAlaskan AthabascanAlbanianAleutAlsatianAmericanApacheArabArapahoArgentineanArmenianAssyrian/Chaldean/SyriacAustralianAustrianBahamianBangladeshiBarbadianBasqueBelgianBelizeanBermudanBhutaneseBlackfeetBolivianBrazilianBritishBritish West IndianBulgarianBurmeseCajunCambodianCanadianCape VerdeanCarpatho RusynCelticCentral AmericanCentral American IndianCherokeeCheyenneChickasawChileanChineseChippewaChoctawColombianColvilleComancheCosta RicanCreeCreekCroatianCrowCubanCypriotCzechCzechoslovakianDanishDelawareDominicanDutchDutch West IndianEastern EuropeanEcuadorianEgyptianEnglishEstonianEthiopianEuropeanFijianFilipinoFinnishFrenchFrench American IndianFrench CanadianGermanGerman RussianGhanaianGreekGuamanian/ChamorroGuatemalanGuyaneseHaitianHmongHonduranHopiHoumaHungarianIcelanderIndian (Asian)IndonesianInupiatIranianIraqiIrishIroquoisIsraeliItalianJamaicanJapaneseJordanianKenyanKiowaKoreanLaotianLatvianLebaneseLiberianLithuanianLumbeeLuxembourgerMacedonianMalaysianMalteseMarshalleseMenomineeMexicanMexican American IndianMongolianMoroccanNative HawaiianNavajoNepaleseNew ZealanderNicaraguanNigerianNorthern EuropeanNorwegianOkinawanOsageOttawaPaiutePakistaniPalestinianPanamanianParaguayanPennsylvania GermanPeruvianPimaPolishPortuguesePotawatomiPuebloPuerto RicanPuget Sound SalishRomanianRussianSalvadoranSamoanScandinavianScotch-IrishScottishSeminoleSenegaleseSerbianShoshoneSierra LeoneanSiouxSlavicSlovakSloveneSomaliSouth AfricanSouth AmericanSouth American IndianSoviet UnionSpaniardSpanishSpanish AmericanSpanish American IndianSri LankanSubsaharan AfricanSudaneseSwedishSwissSyrianTaiwaneseThaiTlingit-HaidaTohono O'OdhamTonganTrinidadian and TobagonianTsimshianTurkishU.S. Virgin IslanderUgandanUkrainianUruguayanUteVenezuelanVietnameseWelshWest IndianYakamaYaquiYugoslavianYumanYup'ikZimbabwean
Immigration
NonimmigrantsImmigrantsAfghanistanAfricaAlbaniaArgentinaArmeniaAsiaAustraliaAustriaBahamasBangladeshBarbadosBelarusBelgiumBelizeBoliviaBosnia and HerzegovinaBrazilBulgariaBurma/MyanmarCabo VerdeCameroonCanadaCaribbeanCentral AmericaChileChinaColombiaCongoCosta RicaCroatiaCubaCzechoslovakiaDenmarkDominicaDominican RepublicEastern AfricaEastern AsiaEastern EuropeEcuadorEgyptEl SalvadorEnglandEritreaEthiopiaEuropeFijiFranceGermanyGhanaGreeceGrenadaGuatemalaGuyanaHaitiHondurasHong KongHungaryIndiaIndonesiaIranIraqIrelandIsraelItalyJamaicaJapanJordanKazakhstanKenyaKoreaKuwaitLaosLatin AmericaLatviaLebanonLiberiaLithuaniaMalaysiaMexicoMicronesiaMiddle AfricaMoldovaMoroccoNepalNetherlandsNicaraguaNigeriaNorth AmericaNorth MacedoniaNorthern AfricaNorthern EuropeNorwayOceaniaPakistanPanamaPeruPhilippinesPolandPortugalRomaniaRussiaSaudi ArabiaScotlandSenegalSerbiaSierra LeoneSingaporeSomaliaSouth AfricaSouth AmericaSouth Central AsiaSouth Eastern AsiaSouthern EuropeSpainSri LankaSt. Vincent and the GrenadinesSudanSwedenSwitzerlandSyriaTaiwanThailandTrinidad and TobagoTurkeyUgandaUkraineUruguayUzbekistanVenezuelaVietnamWest IndiesWestern AfricaWestern AsiaWestern EuropeYemenZaireZimbabweAzores
2 or more Vehicles in Household
Income
Poverty
Unemployment
Labor Participation
Family Structure
Vehicle Availability
Education Level
Disability

Immigrants from Cambodia 2 or more Vehicles in Household
Excellent

56.2%
2+ VEHICLES AVAILABLE
83.6/ 100
METRIC RATING
141st/ 347
METRIC RANK

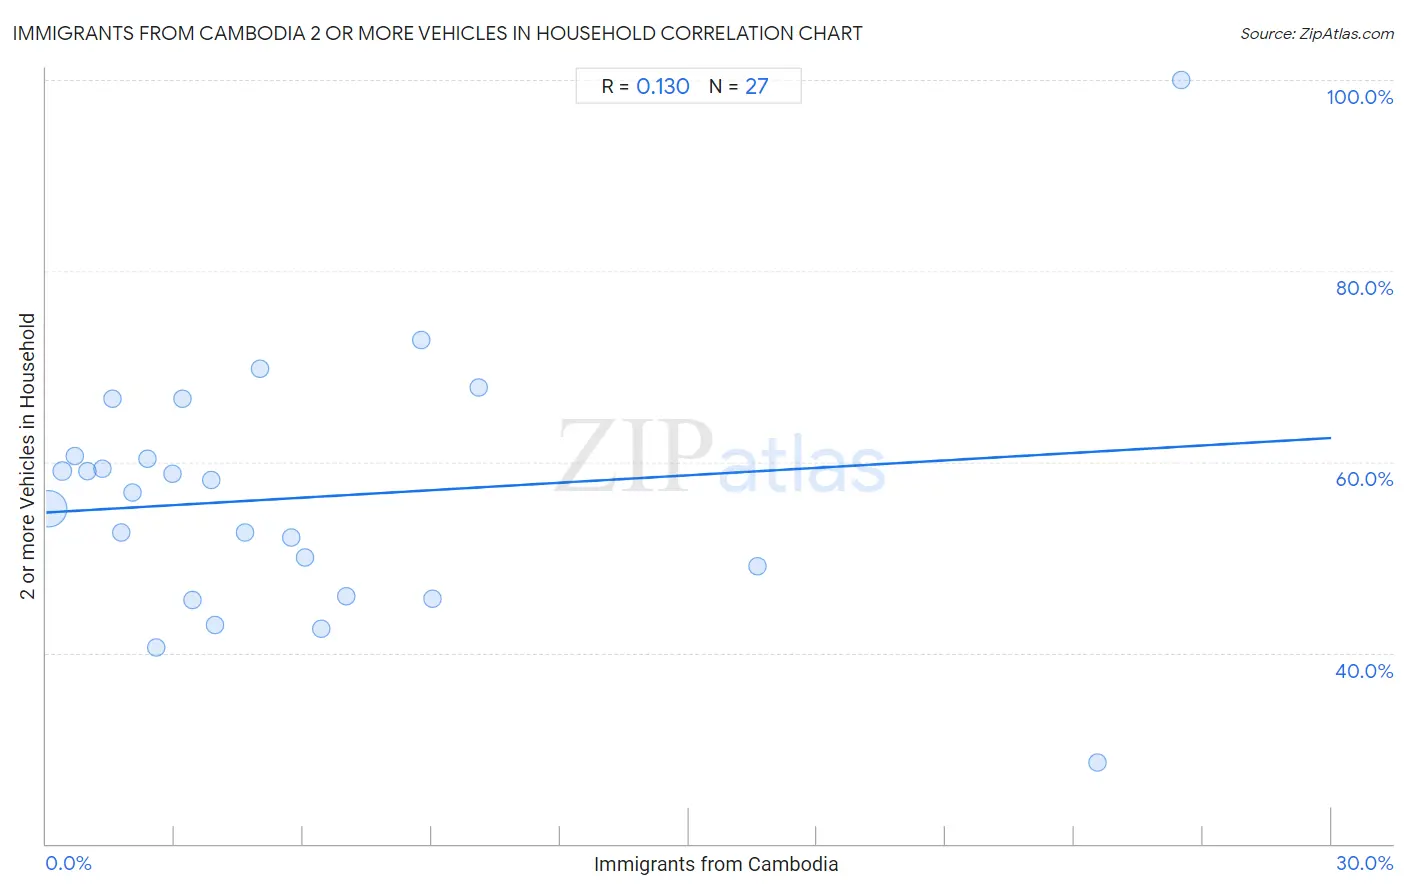
Immigrants from Cambodia 2 or more Vehicles in Household Correlation Chart

The statistical analysis conducted on geographies consisting of 205,137,461 people shows a poor positive correlation between the proportion of Immigrants from Cambodia and percentage of households with 2 or more vehicles available in the United States with a correlation coefficient (R) of 0.130 and weighted average of 56.2%. On average, for every 1% (one percent) increase in Immigrants from Cambodia within a typical geography, there is an increase of 0.26% in percentage of households with 2 or more vehicles available.
Immigrants from Cambodia 2 or more Vehicles in Household
It is essential to understand that the correlation between the percentage of Immigrants from Cambodia and percentage of households with 2 or more vehicles available does not imply a direct cause-and-effect relationship. It remains uncertain whether the presence of Immigrants from Cambodia influences an upward or downward trend in the level of percentage of households with 2 or more vehicles available within an area, or if Immigrants from Cambodia simply ended up residing in those areas with higher or lower levels of percentage of households with 2 or more vehicles available due to other factors.

Demographics Similar to Immigrants from Cambodia by 2 or more Vehicles in Household

In terms of 2 or more vehicles in household, the demographic groups most similar to Immigrants from Cambodia are Latvian (56.2%, a difference of 0.0%), South African (56.2%, a difference of 0.040%), Armenian (56.3%, a difference of 0.050%), Salvadoran (56.3%, a difference of 0.080%), and Cuban (56.3%, a difference of 0.090%).
DemographicsRating | Rank2 or more Vehicles in Household
Immigrants from the Azores
86.6
/100
|
#134
Excellent
56.4%
Blackfeet
86.5
/100
|
#135
Excellent
56.4%
Immigrants from Asia
86.0
/100
|
#136
Excellent
56.3%
Cubans
84.8
/100
|
#137
Excellent
56.3%
Salvadorans
84.7
/100
|
#138
Excellent
56.3%
Armenians
84.3
/100
|
#139
Excellent
56.3%
Latvians
83.6
/100
|
#140
Excellent
56.2%
Immigrants from Cambodia
83.6
/100
|
#141
Excellent
56.2%
South Africans
83.1
/100
|
#142
Excellent
56.2%
Seminole
81.7
/100
|
#143
Excellent
56.2%
Immigrants from Syria
81.4
/100
|
#144
Excellent
56.2%
Syrians
81.2
/100
|
#145
Excellent
56.2%
Venezuelans
80.7
/100
|
#146
Excellent
56.1%
Serbians
80.3
/100
|
#147
Excellent
56.1%
Immigrants from Moldova
80.2
/100
|
#148
Excellent
56.1%

Immigrants from Cambodia 2 or more Vehicles in Household Correlation Summary

MeasurementImmigrants from Cambodia Data2 or more Vehicles in Household Data
Minimum0.067%28.6%
Maximum26.5%100.0%
Range26.4%71.4%
Mean6.0%56.3%
Median3.9%56.8%
Interquartile 25% (IQ1)1.8%46.0%
Interquartile 75% (IQ3)7.0%60.7%
Interquartile Range (IQR)5.2%14.7%
Standard Deviation (Sample)6.7%13.4%
Standard Deviation (Population)6.6%13.1%

Correlation Details

Immigrants from Cambodia PercentileSample Size2 or more Vehicles in Household
[
0.0%
-
0.5%
]
0.067%
180,839,23555.1%
[
0.0%
-
0.5%
]
0.38%
16,210,72559.0%
[
0.5%
-
1.0%
]
0.67%
3,948,97660.7%
[
0.5%
-
1.0%
]
0.96%
1,720,38559.0%
[
1.0%
-
1.5%
]
1.30%
767,56359.3%
[
1.5%
-
2.0%
]
1.53%
227,40366.6%
[
1.5%
-
2.0%
]
1.76%
540,84452.7%
[
2.0%
-
2.5%
]
2.02%
176,23756.8%
[
2.0%
-
2.5%
]
2.36%
93,73860.3%
[
2.5%
-
3.0%
]
2.56%
178,95740.6%
[
2.5%
-
3.0%
]
2.95%
113,21758.8%
[
3.0%
-
3.5%
]
3.19%
3,17166.6%
[
3.0%
-
3.5%
]
3.43%
69,99545.6%
[
3.5%
-
4.0%
]
3.85%
28,19958.2%
[
3.5%
-
4.0%
]
3.95%
58,49442.9%
[
4.5%
-
5.0%
]
4.63%
2,13852.6%
[
4.5%
-
5.0%
]
4.99%
1,06369.8%
[
5.5%
-
6.0%
]
5.71%
3,57552.1%
[
6.0%
-
6.5%
]
6.03%
36550.0%
[
6.0%
-
6.5%
]
6.41%
2,21542.5%
[
7.0%
-
7.5%
]
7.00%
115,14846.0%
[
8.5%
-
9.0%
]
8.75%
56072.7%
[
9.0%
-
9.5%
]
9.02%
1,57545.6%
[
10.0%
-
10.5%
]
10.10%
92167.8%
[
16.5%
-
17.0%
]
16.60%
32,32349.1%
[
24.5%
-
25.0%
]
24.55%
22028.6%
[
26.0%
-
26.5%
]
26.48%
219100.0%