Immigrants from Cambodia Wage/Income Gap

COMPARE

Immigrants from Cambodia
Race
Ancestry
AfghanAfricanAlaska NativeAlaskan AthabascanAlbanianAleutAlsatianAmericanApacheArabArapahoArgentineanArmenianAssyrian/Chaldean/SyriacAustralianAustrianBahamianBangladeshiBarbadianBasqueBelgianBelizeanBermudanBhutaneseBlackfeetBolivianBrazilianBritishBritish West IndianBulgarianBurmeseCajunCambodianCanadianCape VerdeanCarpatho RusynCelticCentral AmericanCentral American IndianCherokeeCheyenneChickasawChileanChineseChippewaChoctawColombianColvilleComancheCosta RicanCreeCreekCroatianCrowCubanCypriotCzechCzechoslovakianDanishDelawareDominicanDutchDutch West IndianEastern EuropeanEcuadorianEgyptianEnglishEstonianEthiopianEuropeanFijianFilipinoFinnishFrenchFrench American IndianFrench CanadianGermanGerman RussianGhanaianGreekGuamanian/ChamorroGuatemalanGuyaneseHaitianHmongHonduranHopiHoumaHungarianIcelanderIndian (Asian)IndonesianInupiatIranianIraqiIrishIroquoisIsraeliItalianJamaicanJapaneseJordanianKenyanKiowaKoreanLaotianLatvianLebaneseLiberianLithuanianLumbeeLuxembourgerMacedonianMalaysianMalteseMarshalleseMenomineeMexicanMexican American IndianMongolianMoroccanNative HawaiianNavajoNepaleseNew ZealanderNicaraguanNigerianNorthern EuropeanNorwegianOkinawanOsageOttawaPaiutePakistaniPalestinianPanamanianParaguayanPennsylvania GermanPeruvianPimaPolishPortuguesePotawatomiPuebloPuerto RicanPuget Sound SalishRomanianRussianSalvadoranSamoanScandinavianScotch-IrishScottishSeminoleSenegaleseSerbianShoshoneSierra LeoneanSiouxSlavicSlovakSloveneSomaliSouth AfricanSouth AmericanSouth American IndianSoviet UnionSpaniardSpanishSpanish AmericanSpanish American IndianSri LankanSubsaharan AfricanSudaneseSwedishSwissSyrianTaiwaneseThaiTlingit-HaidaTohono O'OdhamTonganTrinidadian and TobagonianTsimshianTurkishU.S. Virgin IslanderUgandanUkrainianUruguayanUteVenezuelanVietnameseWelshWest IndianYakamaYaquiYugoslavianYumanYup'ikZimbabwean
Immigration
NonimmigrantsImmigrantsAfghanistanAfricaAlbaniaArgentinaArmeniaAsiaAustraliaAustriaBahamasBangladeshBarbadosBelarusBelgiumBelizeBoliviaBosnia and HerzegovinaBrazilBulgariaBurma/MyanmarCabo VerdeCambodiaCameroonCanadaCaribbeanCentral AmericaChileChinaColombiaCongoCosta RicaCroatiaCubaCzechoslovakiaDenmarkDominicaDominican RepublicEastern AfricaEastern AsiaEastern EuropeEcuadorEgyptEl SalvadorEnglandEritreaEthiopiaEuropeFijiFranceGermanyGhanaGreeceGrenadaGuatemalaGuyanaHaitiHondurasHong KongHungaryIndiaIndonesiaIranIraqIrelandIsraelItalyJamaicaJapanJordanKazakhstanKenyaKoreaKuwaitLaosLatin AmericaLatviaLebanonLiberiaLithuaniaMalaysiaMexicoMicronesiaMiddle AfricaMoldovaMoroccoNepalNetherlandsNicaraguaNigeriaNorth AmericaNorth MacedoniaNorthern AfricaNorthern EuropeNorwayOceaniaPakistanPanamaPeruPhilippinesPolandPortugalRomaniaRussiaSaudi ArabiaScotlandSenegalSerbiaSierra LeoneSingaporeSomaliaSouth AfricaSouth AmericaSouth Central AsiaSouth Eastern AsiaSouthern EuropeSpainSri LankaSt. Vincent and the GrenadinesSudanSwedenSwitzerlandSyriaTaiwanThailandTrinidad and TobagoTurkeyUgandaUkraineUruguayUzbekistanVenezuelaVietnamWest IndiesWestern AfricaWestern AsiaWestern EuropeYemenZaireZimbabweAzores
Select to Compare
Race
Ancestry
AfghanAfricanAlaska NativeAlaskan AthabascanAlbanianAleutAlsatianAmericanApacheArabArapahoArgentineanArmenianAssyrian/Chaldean/SyriacAustralianAustrianBahamianBangladeshiBarbadianBasqueBelgianBelizeanBermudanBhutaneseBlackfeetBolivianBrazilianBritishBritish West IndianBulgarianBurmeseCajunCambodianCanadianCape VerdeanCarpatho RusynCelticCentral AmericanCentral American IndianCherokeeCheyenneChickasawChileanChineseChippewaChoctawColombianColvilleComancheCosta RicanCreeCreekCroatianCrowCubanCypriotCzechCzechoslovakianDanishDelawareDominicanDutchDutch West IndianEastern EuropeanEcuadorianEgyptianEnglishEstonianEthiopianEuropeanFijianFilipinoFinnishFrenchFrench American IndianFrench CanadianGermanGerman RussianGhanaianGreekGuamanian/ChamorroGuatemalanGuyaneseHaitianHmongHonduranHopiHoumaHungarianIcelanderIndian (Asian)IndonesianInupiatIranianIraqiIrishIroquoisIsraeliItalianJamaicanJapaneseJordanianKenyanKiowaKoreanLaotianLatvianLebaneseLiberianLithuanianLumbeeLuxembourgerMacedonianMalaysianMalteseMarshalleseMenomineeMexicanMexican American IndianMongolianMoroccanNative HawaiianNavajoNepaleseNew ZealanderNicaraguanNigerianNorthern EuropeanNorwegianOkinawanOsageOttawaPaiutePakistaniPalestinianPanamanianParaguayanPennsylvania GermanPeruvianPimaPolishPortuguesePotawatomiPuebloPuerto RicanPuget Sound SalishRomanianRussianSalvadoranSamoanScandinavianScotch-IrishScottishSeminoleSenegaleseSerbianShoshoneSierra LeoneanSiouxSlavicSlovakSloveneSomaliSouth AfricanSouth AmericanSouth American IndianSoviet UnionSpaniardSpanishSpanish AmericanSpanish American IndianSri LankanSubsaharan AfricanSudaneseSwedishSwissSyrianTaiwaneseThaiTlingit-HaidaTohono O'OdhamTonganTrinidadian and TobagonianTsimshianTurkishU.S. Virgin IslanderUgandanUkrainianUruguayanUteVenezuelanVietnameseWelshWest IndianYakamaYaquiYugoslavianYumanYup'ikZimbabwean
Immigration
NonimmigrantsImmigrantsAfghanistanAfricaAlbaniaArgentinaArmeniaAsiaAustraliaAustriaBahamasBangladeshBarbadosBelarusBelgiumBelizeBoliviaBosnia and HerzegovinaBrazilBulgariaBurma/MyanmarCabo VerdeCameroonCanadaCaribbeanCentral AmericaChileChinaColombiaCongoCosta RicaCroatiaCubaCzechoslovakiaDenmarkDominicaDominican RepublicEastern AfricaEastern AsiaEastern EuropeEcuadorEgyptEl SalvadorEnglandEritreaEthiopiaEuropeFijiFranceGermanyGhanaGreeceGrenadaGuatemalaGuyanaHaitiHondurasHong KongHungaryIndiaIndonesiaIranIraqIrelandIsraelItalyJamaicaJapanJordanKazakhstanKenyaKoreaKuwaitLaosLatin AmericaLatviaLebanonLiberiaLithuaniaMalaysiaMexicoMicronesiaMiddle AfricaMoldovaMoroccoNepalNetherlandsNicaraguaNigeriaNorth AmericaNorth MacedoniaNorthern AfricaNorthern EuropeNorwayOceaniaPakistanPanamaPeruPhilippinesPolandPortugalRomaniaRussiaSaudi ArabiaScotlandSenegalSerbiaSierra LeoneSingaporeSomaliaSouth AfricaSouth AmericaSouth Central AsiaSouth Eastern AsiaSouthern EuropeSpainSri LankaSt. Vincent and the GrenadinesSudanSwedenSwitzerlandSyriaTaiwanThailandTrinidad and TobagoTurkeyUgandaUkraineUruguayUzbekistanVenezuelaVietnamWest IndiesWestern AfricaWestern AsiaWestern EuropeYemenZaireZimbabweAzores
Wage/Income Gap
Income
Poverty
Unemployment
Labor Participation
Family Structure
Vehicle Availability
Education Level
Disability

Immigrants from Cambodia Wage/Income Gap
Exceptional

23.3%
WAGE/INCOME GAP
99.7/ 100
METRIC RATING
85th/ 347
METRIC RANK

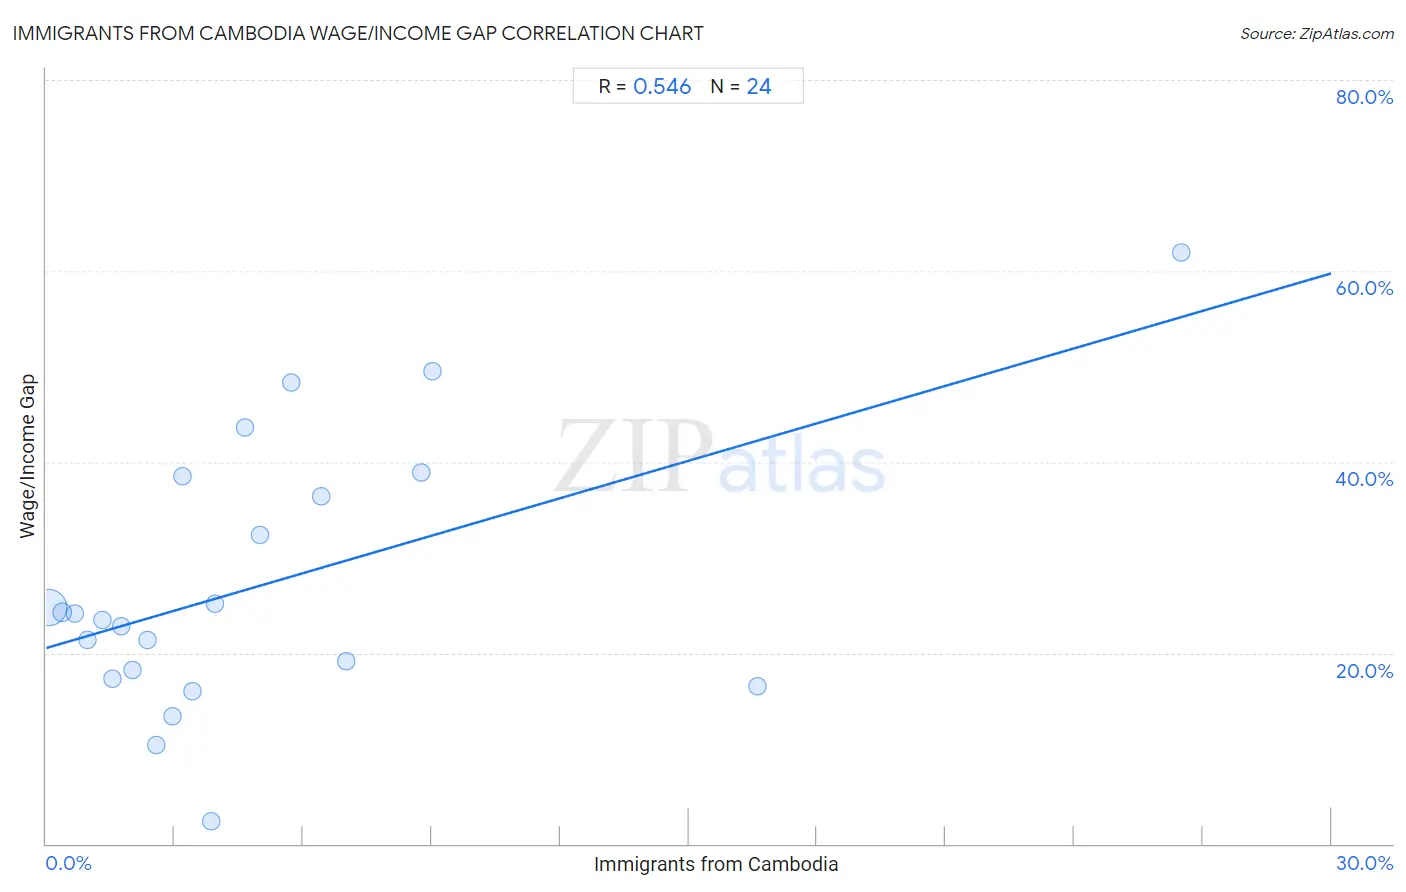
Immigrants from Cambodia Wage/Income Gap Correlation Chart

The statistical analysis conducted on geographies consisting of 205,133,865 people shows a substantial positive correlation between the proportion of Immigrants from Cambodia and wage/income gap percentage in the United States with a correlation coefficient (R) of 0.546 and weighted average of 23.3%. On average, for every 1% (one percent) increase in Immigrants from Cambodia within a typical geography, there is an increase of 1.3% in wage/income gap percentage.
Immigrants from Cambodia Wage/Income Gap
It is essential to understand that the correlation between the percentage of Immigrants from Cambodia and wage/income gap percentage does not imply a direct cause-and-effect relationship. It remains uncertain whether the presence of Immigrants from Cambodia influences an upward or downward trend in the level of wage/income gap percentage within an area, or if Immigrants from Cambodia simply ended up residing in those areas with higher or lower levels of wage/income gap percentage due to other factors.

Demographics Similar to Immigrants from Cambodia by Wage/Income Gap

In terms of wage/income gap, the demographic groups most similar to Immigrants from Cambodia are Cuban (23.3%, a difference of 0.050%), Cheyenne (23.3%, a difference of 0.20%), Yuman (23.3%, a difference of 0.25%), Immigrants from Africa (23.2%, a difference of 0.43%), and Immigrants from Panama (23.4%, a difference of 0.57%).
DemographicsRating | RankWage/Income Gap
Nigerians
99.9
/100
|
#78
Exceptional
23.0%
Immigrants from Nicaragua
99.9
/100
|
#79
Exceptional
23.0%
Salvadorans
99.9
/100
|
#80
Exceptional
23.0%
Bermudans
99.8
/100
|
#81
Exceptional
23.1%
Central Americans
99.8
/100
|
#82
Exceptional
23.1%
Immigrants from Africa
99.8
/100
|
#83
Exceptional
23.2%
Cubans
99.7
/100
|
#84
Exceptional
23.3%
Immigrants from Cambodia
99.7
/100
|
#85
Exceptional
23.3%
Cheyenne
99.7
/100
|
#86
Exceptional
23.3%
Yuman
99.7
/100
|
#87
Exceptional
23.3%
Immigrants from Panama
99.6
/100
|
#88
Exceptional
23.4%
Marshallese
99.6
/100
|
#89
Exceptional
23.4%
Nicaraguans
99.6
/100
|
#90
Exceptional
23.4%
Arapaho
99.6
/100
|
#91
Exceptional
23.5%
Immigrants from Honduras
99.5
/100
|
#92
Exceptional
23.5%

Immigrants from Cambodia Wage/Income Gap Correlation Summary

MeasurementImmigrants from Cambodia DataWage/Income Gap Data
Minimum0.067%2.3%
Maximum26.5%61.9%
Range26.4%59.6%
Mean5.0%27.1%
Median3.3%23.8%
Interquartile 25% (IQ1)1.6%17.8%
Interquartile 75% (IQ3)6.1%37.4%
Interquartile Range (IQR)4.4%19.7%
Standard Deviation (Sample)5.8%14.0%
Standard Deviation (Population)5.7%13.7%

Correlation Details

Immigrants from Cambodia PercentileSample SizeWage/Income Gap
[
0.0%
-
0.5%
]
0.067%
180,851,46524.7%
[
0.0%
-
0.5%
]
0.38%
16,206,58424.2%
[
0.5%
-
1.0%
]
0.67%
3,948,97624.1%
[
0.5%
-
1.0%
]
0.96%
1,717,18821.4%
[
1.0%
-
1.5%
]
1.30%
768,15023.4%
[
1.5%
-
2.0%
]
1.54%
227,47917.3%
[
1.5%
-
2.0%
]
1.76%
537,96622.8%
[
2.0%
-
2.5%
]
2.02%
176,23718.3%
[
2.0%
-
2.5%
]
2.36%
91,42821.4%
[
2.5%
-
3.0%
]
2.56%
178,73510.3%
[
2.5%
-
3.0%
]
2.95%
113,21713.3%
[
3.0%
-
3.5%
]
3.19%
2,79438.6%
[
3.0%
-
3.5%
]
3.43%
69,99515.9%
[
3.5%
-
4.0%
]
3.86%
26,4292.3%
[
3.5%
-
4.0%
]
3.95%
58,49425.1%
[
4.5%
-
5.0%
]
4.63%
2,05043.6%
[
4.5%
-
5.0%
]
4.99%
1,06332.4%
[
5.5%
-
6.0%
]
5.71%
3,57548.3%
[
6.0%
-
6.5%
]
6.41%
2,21536.3%
[
7.0%
-
7.5%
]
7.00%
115,14819.1%
[
8.5%
-
9.0%
]
8.75%
56038.9%
[
9.0%
-
9.5%
]
9.02%
1,57549.5%
[
16.5%
-
17.0%
]
16.60%
32,32316.5%
[
26.0%
-
26.5%
]
26.48%
21961.9%