Immigrants from Cambodia Disability

COMPARE

Immigrants from Cambodia
Race
Ancestry
AfghanAfricanAlaska NativeAlaskan AthabascanAlbanianAleutAlsatianAmericanApacheArabArapahoArgentineanArmenianAssyrian/Chaldean/SyriacAustralianAustrianBahamianBangladeshiBarbadianBasqueBelgianBelizeanBermudanBhutaneseBlackfeetBolivianBrazilianBritishBritish West IndianBulgarianBurmeseCajunCambodianCanadianCape VerdeanCarpatho RusynCelticCentral AmericanCentral American IndianCherokeeCheyenneChickasawChileanChineseChippewaChoctawColombianColvilleComancheCosta RicanCreeCreekCroatianCrowCubanCypriotCzechCzechoslovakianDanishDelawareDominicanDutchDutch West IndianEastern EuropeanEcuadorianEgyptianEnglishEstonianEthiopianEuropeanFijianFilipinoFinnishFrenchFrench American IndianFrench CanadianGermanGerman RussianGhanaianGreekGuamanian/ChamorroGuatemalanGuyaneseHaitianHmongHonduranHopiHoumaHungarianIcelanderIndian (Asian)IndonesianInupiatIranianIraqiIrishIroquoisIsraeliItalianJamaicanJapaneseJordanianKenyanKiowaKoreanLaotianLatvianLebaneseLiberianLithuanianLumbeeLuxembourgerMacedonianMalaysianMalteseMarshalleseMenomineeMexicanMexican American IndianMongolianMoroccanNative HawaiianNavajoNepaleseNew ZealanderNicaraguanNigerianNorthern EuropeanNorwegianOkinawanOsageOttawaPaiutePakistaniPalestinianPanamanianParaguayanPennsylvania GermanPeruvianPimaPolishPortuguesePotawatomiPuebloPuerto RicanPuget Sound SalishRomanianRussianSalvadoranSamoanScandinavianScotch-IrishScottishSeminoleSenegaleseSerbianShoshoneSierra LeoneanSiouxSlavicSlovakSloveneSomaliSouth AfricanSouth AmericanSouth American IndianSoviet UnionSpaniardSpanishSpanish AmericanSpanish American IndianSri LankanSubsaharan AfricanSudaneseSwedishSwissSyrianTaiwaneseThaiTlingit-HaidaTohono O'OdhamTonganTrinidadian and TobagonianTsimshianTurkishU.S. Virgin IslanderUgandanUkrainianUruguayanUteVenezuelanVietnameseWelshWest IndianYakamaYaquiYugoslavianYumanYup'ikZimbabwean
Immigration
NonimmigrantsImmigrantsAfghanistanAfricaAlbaniaArgentinaArmeniaAsiaAustraliaAustriaBahamasBangladeshBarbadosBelarusBelgiumBelizeBoliviaBosnia and HerzegovinaBrazilBulgariaBurma/MyanmarCabo VerdeCambodiaCameroonCanadaCaribbeanCentral AmericaChileChinaColombiaCongoCosta RicaCroatiaCubaCzechoslovakiaDenmarkDominicaDominican RepublicEastern AfricaEastern AsiaEastern EuropeEcuadorEgyptEl SalvadorEnglandEritreaEthiopiaEuropeFijiFranceGermanyGhanaGreeceGrenadaGuatemalaGuyanaHaitiHondurasHong KongHungaryIndiaIndonesiaIranIraqIrelandIsraelItalyJamaicaJapanJordanKazakhstanKenyaKoreaKuwaitLaosLatin AmericaLatviaLebanonLiberiaLithuaniaMalaysiaMexicoMicronesiaMiddle AfricaMoldovaMoroccoNepalNetherlandsNicaraguaNigeriaNorth AmericaNorth MacedoniaNorthern AfricaNorthern EuropeNorwayOceaniaPakistanPanamaPeruPhilippinesPolandPortugalRomaniaRussiaSaudi ArabiaScotlandSenegalSerbiaSierra LeoneSingaporeSomaliaSouth AfricaSouth AmericaSouth Central AsiaSouth Eastern AsiaSouthern EuropeSpainSri LankaSt. Vincent and the GrenadinesSudanSwedenSwitzerlandSyriaTaiwanThailandTrinidad and TobagoTurkeyUgandaUkraineUruguayUzbekistanVenezuelaVietnamWest IndiesWestern AfricaWestern AsiaWestern EuropeYemenZaireZimbabweAzores
Select to Compare
Race
Ancestry
AfghanAfricanAlaska NativeAlaskan AthabascanAlbanianAleutAlsatianAmericanApacheArabArapahoArgentineanArmenianAssyrian/Chaldean/SyriacAustralianAustrianBahamianBangladeshiBarbadianBasqueBelgianBelizeanBermudanBhutaneseBlackfeetBolivianBrazilianBritishBritish West IndianBulgarianBurmeseCajunCambodianCanadianCape VerdeanCarpatho RusynCelticCentral AmericanCentral American IndianCherokeeCheyenneChickasawChileanChineseChippewaChoctawColombianColvilleComancheCosta RicanCreeCreekCroatianCrowCubanCypriotCzechCzechoslovakianDanishDelawareDominicanDutchDutch West IndianEastern EuropeanEcuadorianEgyptianEnglishEstonianEthiopianEuropeanFijianFilipinoFinnishFrenchFrench American IndianFrench CanadianGermanGerman RussianGhanaianGreekGuamanian/ChamorroGuatemalanGuyaneseHaitianHmongHonduranHopiHoumaHungarianIcelanderIndian (Asian)IndonesianInupiatIranianIraqiIrishIroquoisIsraeliItalianJamaicanJapaneseJordanianKenyanKiowaKoreanLaotianLatvianLebaneseLiberianLithuanianLumbeeLuxembourgerMacedonianMalaysianMalteseMarshalleseMenomineeMexicanMexican American IndianMongolianMoroccanNative HawaiianNavajoNepaleseNew ZealanderNicaraguanNigerianNorthern EuropeanNorwegianOkinawanOsageOttawaPaiutePakistaniPalestinianPanamanianParaguayanPennsylvania GermanPeruvianPimaPolishPortuguesePotawatomiPuebloPuerto RicanPuget Sound SalishRomanianRussianSalvadoranSamoanScandinavianScotch-IrishScottishSeminoleSenegaleseSerbianShoshoneSierra LeoneanSiouxSlavicSlovakSloveneSomaliSouth AfricanSouth AmericanSouth American IndianSoviet UnionSpaniardSpanishSpanish AmericanSpanish American IndianSri LankanSubsaharan AfricanSudaneseSwedishSwissSyrianTaiwaneseThaiTlingit-HaidaTohono O'OdhamTonganTrinidadian and TobagonianTsimshianTurkishU.S. Virgin IslanderUgandanUkrainianUruguayanUteVenezuelanVietnameseWelshWest IndianYakamaYaquiYugoslavianYumanYup'ikZimbabwean
Immigration
NonimmigrantsImmigrantsAfghanistanAfricaAlbaniaArgentinaArmeniaAsiaAustraliaAustriaBahamasBangladeshBarbadosBelarusBelgiumBelizeBoliviaBosnia and HerzegovinaBrazilBulgariaBurma/MyanmarCabo VerdeCameroonCanadaCaribbeanCentral AmericaChileChinaColombiaCongoCosta RicaCroatiaCubaCzechoslovakiaDenmarkDominicaDominican RepublicEastern AfricaEastern AsiaEastern EuropeEcuadorEgyptEl SalvadorEnglandEritreaEthiopiaEuropeFijiFranceGermanyGhanaGreeceGrenadaGuatemalaGuyanaHaitiHondurasHong KongHungaryIndiaIndonesiaIranIraqIrelandIsraelItalyJamaicaJapanJordanKazakhstanKenyaKoreaKuwaitLaosLatin AmericaLatviaLebanonLiberiaLithuaniaMalaysiaMexicoMicronesiaMiddle AfricaMoldovaMoroccoNepalNetherlandsNicaraguaNigeriaNorth AmericaNorth MacedoniaNorthern AfricaNorthern EuropeNorwayOceaniaPakistanPanamaPeruPhilippinesPolandPortugalRomaniaRussiaSaudi ArabiaScotlandSenegalSerbiaSierra LeoneSingaporeSomaliaSouth AfricaSouth AmericaSouth Central AsiaSouth Eastern AsiaSouthern EuropeSpainSri LankaSt. Vincent and the GrenadinesSudanSwedenSwitzerlandSyriaTaiwanThailandTrinidad and TobagoTurkeyUgandaUkraineUruguayUzbekistanVenezuelaVietnamWest IndiesWestern AfricaWestern AsiaWestern EuropeYemenZaireZimbabweAzores
Disability
Income
Poverty
Unemployment
Labor Participation
Family Structure
Vehicle Availability
Education Level
Disability

Immigrants from Cambodia Disability
Tragic

12.0%
DISABILITY
7.3/ 100
METRIC RATING
211th/ 347
METRIC RANK

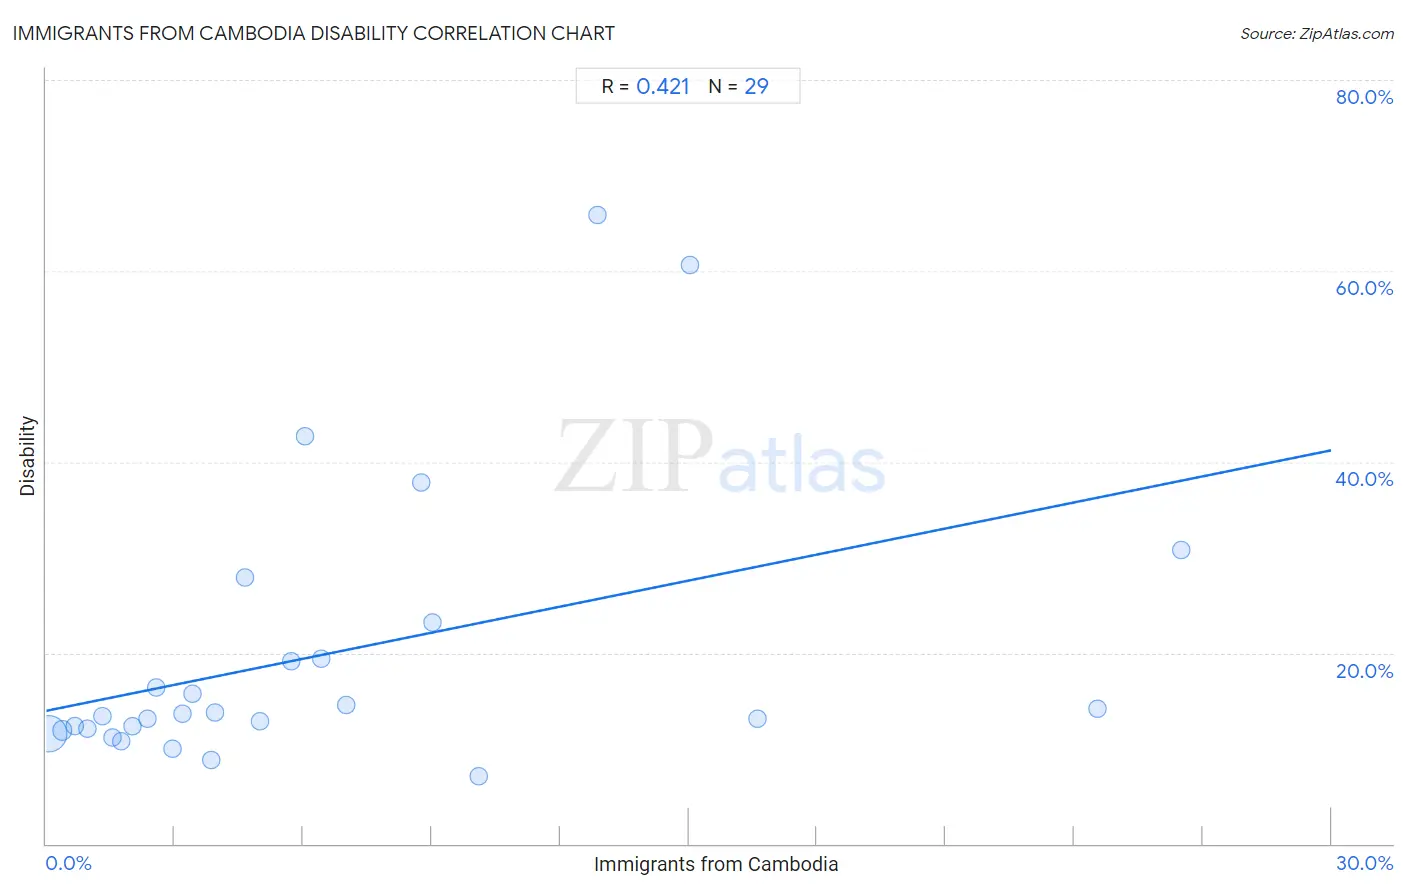
Immigrants from Cambodia Disability Correlation Chart

The statistical analysis conducted on geographies consisting of 205,156,443 people shows a moderate positive correlation between the proportion of Immigrants from Cambodia and percentage of population with a disability in the United States with a correlation coefficient (R) of 0.421 and weighted average of 12.0%. On average, for every 1% (one percent) increase in Immigrants from Cambodia within a typical geography, there is an increase of 0.91% in percentage of population with a disability.
Immigrants from Cambodia Disability
It is essential to understand that the correlation between the percentage of Immigrants from Cambodia and percentage of population with a disability does not imply a direct cause-and-effect relationship. It remains uncertain whether the presence of Immigrants from Cambodia influences an upward or downward trend in the level of percentage of population with a disability within an area, or if Immigrants from Cambodia simply ended up residing in those areas with higher or lower levels of percentage of population with a disability due to other factors.

Demographics Similar to Immigrants from Cambodia by Disability

In terms of disability, the demographic groups most similar to Immigrants from Cambodia are Austrian (12.0%, a difference of 0.030%), Immigrants from Iraq (12.0%, a difference of 0.030%), Czech (12.0%, a difference of 0.080%), Immigrants from Somalia (12.0%, a difference of 0.080%), and Danish (12.0%, a difference of 0.20%).
DemographicsRating | RankDisability
Mexican American Indians
11.4
/100
|
#204
Poor
12.0%
Immigrants from Western Europe
10.1
/100
|
#205
Poor
12.0%
Immigrants from Senegal
9.4
/100
|
#206
Tragic
12.0%
Immigrants from Thailand
9.3
/100
|
#207
Tragic
12.0%
Immigrants from Caribbean
9.1
/100
|
#208
Tragic
12.0%
Danes
8.7
/100
|
#209
Tragic
12.0%
Czechs
7.9
/100
|
#210
Tragic
12.0%
Immigrants from Cambodia
7.3
/100
|
#211
Tragic
12.0%
Austrians
7.2
/100
|
#212
Tragic
12.0%
Immigrants from Iraq
7.1
/100
|
#213
Tragic
12.0%
Immigrants from Somalia
6.8
/100
|
#214
Tragic
12.0%
Immigrants from Canada
6.1
/100
|
#215
Tragic
12.1%
Panamanians
5.4
/100
|
#216
Tragic
12.1%
Immigrants from North America
5.3
/100
|
#217
Tragic
12.1%
Immigrants from Jamaica
5.0
/100
|
#218
Tragic
12.1%

Immigrants from Cambodia Disability Correlation Summary

MeasurementImmigrants from Cambodia DataDisability Data
Minimum0.067%7.1%
Maximum26.5%65.9%
Range26.4%58.9%
Mean6.5%19.9%
Median3.9%13.6%
Interquartile 25% (IQ1)1.9%12.0%
Interquartile 75% (IQ3)8.9%21.2%
Interquartile Range (IQR)7.0%9.2%
Standard Deviation (Sample)6.8%14.7%
Standard Deviation (Population)6.7%14.4%

Correlation Details

Immigrants from Cambodia PercentileSample SizeDisability
[
0.0%
-
0.5%
]
0.067%
180,853,64911.5%
[
0.0%
-
0.5%
]
0.38%
16,212,49011.9%
[
0.5%
-
1.0%
]
0.67%
3,948,97612.4%
[
0.5%
-
1.0%
]
0.96%
1,720,38512.1%
[
1.0%
-
1.5%
]
1.30%
768,15013.4%
[
1.5%
-
2.0%
]
1.53%
229,16111.2%
[
1.5%
-
2.0%
]
1.76%
540,84410.8%
[
2.0%
-
2.5%
]
2.02%
176,23712.3%
[
2.0%
-
2.5%
]
2.36%
93,73813.1%
[
2.5%
-
3.0%
]
2.56%
178,95716.3%
[
2.5%
-
3.0%
]
2.95%
113,2179.9%
[
3.0%
-
3.5%
]
3.19%
3,17113.6%
[
3.0%
-
3.5%
]
3.43%
69,99515.8%
[
3.5%
-
4.0%
]
3.85%
28,1998.7%
[
3.5%
-
4.0%
]
3.95%
58,49413.7%
[
4.5%
-
5.0%
]
4.63%
2,13827.9%
[
4.5%
-
5.0%
]
4.99%
1,06312.9%
[
5.5%
-
6.0%
]
5.71%
3,57519.1%
[
6.0%
-
6.5%
]
6.03%
36542.7%
[
6.0%
-
6.5%
]
6.41%
2,21519.3%
[
7.0%
-
7.5%
]
7.00%
115,14814.5%
[
8.5%
-
9.0%
]
8.75%
56037.9%
[
9.0%
-
9.5%
]
9.02%
1,57523.1%
[
10.0%
-
10.5%
]
10.10%
9217.1%
[
12.5%
-
13.0%
]
12.88%
13265.9%
[
15.0%
-
15.5%
]
15.03%
32660.6%
[
16.5%
-
17.0%
]
16.60%
32,32313.1%
[
24.5%
-
25.0%
]
24.55%
22014.1%
[
26.0%
-
26.5%
]
26.48%
21930.8%