Icelander College, Under 1 year

COMPARE

Icelander
Race
Ancestry
AfghanAfricanAlaska NativeAlaskan AthabascanAlbanianAleutAlsatianAmericanApacheArabArapahoArgentineanArmenianAssyrian/Chaldean/SyriacAustralianAustrianBahamianBangladeshiBarbadianBasqueBelgianBelizeanBermudanBhutaneseBlackfeetBolivianBrazilianBritishBritish West IndianBulgarianBurmeseCajunCambodianCanadianCape VerdeanCarpatho RusynCelticCentral AmericanCentral American IndianCherokeeCheyenneChickasawChileanChineseChippewaChoctawColombianColvilleComancheCosta RicanCreeCreekCroatianCrowCubanCypriotCzechCzechoslovakianDanishDelawareDominicanDutchDutch West IndianEastern EuropeanEcuadorianEgyptianEnglishEstonianEthiopianEuropeanFijianFilipinoFinnishFrenchFrench American IndianFrench CanadianGermanGerman RussianGhanaianGreekGuamanian/ChamorroGuatemalanGuyaneseHaitianHmongHonduranHopiHoumaHungarianIcelanderIndian (Asian)IndonesianInupiatIranianIraqiIrishIroquoisIsraeliItalianJamaicanJapaneseJordanianKenyanKiowaKoreanLaotianLatvianLebaneseLiberianLithuanianLumbeeLuxembourgerMacedonianMalaysianMalteseMarshalleseMenomineeMexicanMexican American IndianMongolianMoroccanNative HawaiianNavajoNepaleseNew ZealanderNicaraguanNigerianNorthern EuropeanNorwegianOkinawanOsageOttawaPaiutePakistaniPalestinianPanamanianParaguayanPennsylvania GermanPeruvianPimaPolishPortuguesePotawatomiPuebloPuerto RicanPuget Sound SalishRomanianRussianSalvadoranSamoanScandinavianScotch-IrishScottishSeminoleSenegaleseSerbianShoshoneSierra LeoneanSiouxSlavicSlovakSloveneSomaliSouth AfricanSouth AmericanSouth American IndianSoviet UnionSpaniardSpanishSpanish AmericanSpanish American IndianSri LankanSubsaharan AfricanSudaneseSwedishSwissSyrianTaiwaneseThaiTlingit-HaidaTohono O'OdhamTonganTrinidadian and TobagonianTsimshianTurkishU.S. Virgin IslanderUgandanUkrainianUruguayanUteVenezuelanVietnameseWelshWest IndianYakamaYaquiYugoslavianYumanYup'ikZimbabwean
Immigration
NonimmigrantsImmigrantsAfghanistanAfricaAlbaniaArgentinaArmeniaAsiaAustraliaAustriaBahamasBangladeshBarbadosBelarusBelgiumBelizeBoliviaBosnia and HerzegovinaBrazilBulgariaBurma/MyanmarCabo VerdeCambodiaCameroonCanadaCaribbeanCentral AmericaChileChinaColombiaCongoCosta RicaCroatiaCubaCzechoslovakiaDenmarkDominicaDominican RepublicEastern AfricaEastern AsiaEastern EuropeEcuadorEgyptEl SalvadorEnglandEritreaEthiopiaEuropeFijiFranceGermanyGhanaGreeceGrenadaGuatemalaGuyanaHaitiHondurasHong KongHungaryIndiaIndonesiaIranIraqIrelandIsraelItalyJamaicaJapanJordanKazakhstanKenyaKoreaKuwaitLaosLatin AmericaLatviaLebanonLiberiaLithuaniaMalaysiaMexicoMicronesiaMiddle AfricaMoldovaMoroccoNepalNetherlandsNicaraguaNigeriaNorth AmericaNorth MacedoniaNorthern AfricaNorthern EuropeNorwayOceaniaPakistanPanamaPeruPhilippinesPolandPortugalRomaniaRussiaSaudi ArabiaScotlandSenegalSerbiaSierra LeoneSingaporeSomaliaSouth AfricaSouth AmericaSouth Central AsiaSouth Eastern AsiaSouthern EuropeSpainSri LankaSt. Vincent and the GrenadinesSudanSwedenSwitzerlandSyriaTaiwanThailandTrinidad and TobagoTurkeyUgandaUkraineUruguayUzbekistanVenezuelaVietnamWest IndiesWestern AfricaWestern AsiaWestern EuropeYemenZaireZimbabweAzores
Select to Compare
Race
Ancestry
AfghanAfricanAlaska NativeAlaskan AthabascanAlbanianAleutAlsatianAmericanApacheArabArapahoArgentineanArmenianAssyrian/Chaldean/SyriacAustralianAustrianBahamianBangladeshiBarbadianBasqueBelgianBelizeanBermudanBhutaneseBlackfeetBolivianBrazilianBritishBritish West IndianBulgarianBurmeseCajunCambodianCanadianCape VerdeanCarpatho RusynCelticCentral AmericanCentral American IndianCherokeeCheyenneChickasawChileanChineseChippewaChoctawColombianColvilleComancheCosta RicanCreeCreekCroatianCrowCubanCypriotCzechCzechoslovakianDanishDelawareDominicanDutchDutch West IndianEastern EuropeanEcuadorianEgyptianEnglishEstonianEthiopianEuropeanFijianFilipinoFinnishFrenchFrench American IndianFrench CanadianGermanGerman RussianGhanaianGreekGuamanian/ChamorroGuatemalanGuyaneseHaitianHmongHonduranHopiHoumaHungarianIndian (Asian)IndonesianInupiatIranianIraqiIrishIroquoisIsraeliItalianJamaicanJapaneseJordanianKenyanKiowaKoreanLaotianLatvianLebaneseLiberianLithuanianLumbeeLuxembourgerMacedonianMalaysianMalteseMarshalleseMenomineeMexicanMexican American IndianMongolianMoroccanNative HawaiianNavajoNepaleseNew ZealanderNicaraguanNigerianNorthern EuropeanNorwegianOkinawanOsageOttawaPaiutePakistaniPalestinianPanamanianParaguayanPennsylvania GermanPeruvianPimaPolishPortuguesePotawatomiPuebloPuerto RicanPuget Sound SalishRomanianRussianSalvadoranSamoanScandinavianScotch-IrishScottishSeminoleSenegaleseSerbianShoshoneSierra LeoneanSiouxSlavicSlovakSloveneSomaliSouth AfricanSouth AmericanSouth American IndianSoviet UnionSpaniardSpanishSpanish AmericanSpanish American IndianSri LankanSubsaharan AfricanSudaneseSwedishSwissSyrianTaiwaneseThaiTlingit-HaidaTohono O'OdhamTonganTrinidadian and TobagonianTsimshianTurkishU.S. Virgin IslanderUgandanUkrainianUruguayanUteVenezuelanVietnameseWelshWest IndianYakamaYaquiYugoslavianYumanYup'ikZimbabwean
Immigration
NonimmigrantsImmigrantsAfghanistanAfricaAlbaniaArgentinaArmeniaAsiaAustraliaAustriaBahamasBangladeshBarbadosBelarusBelgiumBelizeBoliviaBosnia and HerzegovinaBrazilBulgariaBurma/MyanmarCabo VerdeCambodiaCameroonCanadaCaribbeanCentral AmericaChileChinaColombiaCongoCosta RicaCroatiaCubaCzechoslovakiaDenmarkDominicaDominican RepublicEastern AfricaEastern AsiaEastern EuropeEcuadorEgyptEl SalvadorEnglandEritreaEthiopiaEuropeFijiFranceGermanyGhanaGreeceGrenadaGuatemalaGuyanaHaitiHondurasHong KongHungaryIndiaIndonesiaIranIraqIrelandIsraelItalyJamaicaJapanJordanKazakhstanKenyaKoreaKuwaitLaosLatin AmericaLatviaLebanonLiberiaLithuaniaMalaysiaMexicoMicronesiaMiddle AfricaMoldovaMoroccoNepalNetherlandsNicaraguaNigeriaNorth AmericaNorth MacedoniaNorthern AfricaNorthern EuropeNorwayOceaniaPakistanPanamaPeruPhilippinesPolandPortugalRomaniaRussiaSaudi ArabiaScotlandSenegalSerbiaSierra LeoneSingaporeSomaliaSouth AfricaSouth AmericaSouth Central AsiaSouth Eastern AsiaSouthern EuropeSpainSri LankaSt. Vincent and the GrenadinesSudanSwedenSwitzerlandSyriaTaiwanThailandTrinidad and TobagoTurkeyUgandaUkraineUruguayUzbekistanVenezuelaVietnamWest IndiesWestern AfricaWestern AsiaWestern EuropeYemenZaireZimbabweAzores
College, Under 1 year
Income
Poverty
Unemployment
Labor Participation
Family Structure
Vehicle Availability
Education Level
Disability

Icelander College, Under 1 year
Exceptional

68.3%
COLLEGE, UNDER 1 YEAR
98.1/ 100
METRIC RATING
90th/ 347
METRIC RANK

Icelander College, Under 1 year Correlation Chart

The statistical analysis conducted on geographies consisting of 159,668,975 people shows no correlation between the proportion of Icelanders and percentage of population with at least college, under 1 year education in the United States with a correlation coefficient (R) of 0.035 and weighted average of 68.3%. On average, for every 1% (one percent) increase in Icelanders within a typical geography, there is an increase of 0.038% in percentage of population with at least college, under 1 year education.
Icelander College, Under 1 year
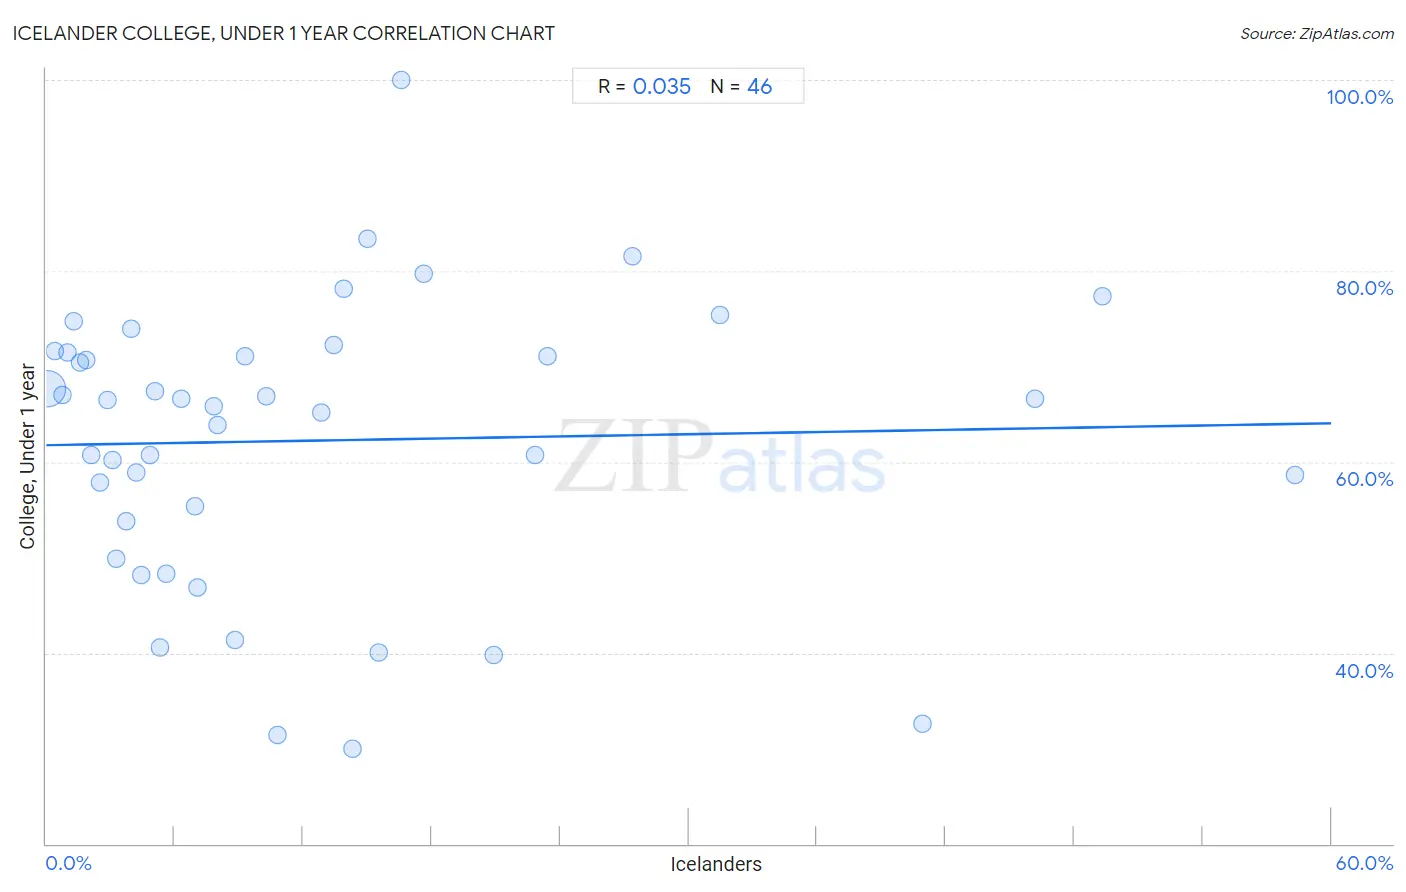
It is essential to understand that the correlation between the percentage of Icelanders and percentage of population with at least college, under 1 year education does not imply a direct cause-and-effect relationship. It remains uncertain whether the presence of Icelanders influences an upward or downward trend in the level of percentage of population with at least college, under 1 year education within an area, or if Icelanders simply ended up residing in those areas with higher or lower levels of percentage of population with at least college, under 1 year education due to other factors.

Demographics Similar to Icelanders by College, Under 1 year

In terms of college, under 1 year, the demographic groups most similar to Icelanders are European (68.2%, a difference of 0.030%), Luxembourger (68.2%, a difference of 0.040%), Ethiopian (68.3%, a difference of 0.060%), Croatian (68.3%, a difference of 0.070%), and Chinese (68.3%, a difference of 0.090%).
DemographicsRating | RankCollege, Under 1 year
Argentineans
98.4
/100
|
#83
Exceptional
68.4%
Immigrants from Hungary
98.3
/100
|
#84
Exceptional
68.3%
Egyptians
98.3
/100
|
#85
Exceptional
68.3%
Immigrants from Lebanon
98.3
/100
|
#86
Exceptional
68.3%
Chinese
98.3
/100
|
#87
Exceptional
68.3%
Croatians
98.2
/100
|
#88
Exceptional
68.3%
Ethiopians
98.2
/100
|
#89
Exceptional
68.3%
Icelanders
98.1
/100
|
#90
Exceptional
68.3%
Europeans
98.1
/100
|
#91
Exceptional
68.2%
Luxembourgers
98.1
/100
|
#92
Exceptional
68.2%
Romanians
97.9
/100
|
#93
Exceptional
68.2%
Armenians
97.7
/100
|
#94
Exceptional
68.1%
Immigrants from Pakistan
97.5
/100
|
#95
Exceptional
68.0%
Jordanians
97.4
/100
|
#96
Exceptional
68.0%
Immigrants from Ethiopia
97.3
/100
|
#97
Exceptional
68.0%

Icelander College, Under 1 year Correlation Summary

MeasurementIcelander DataCollege, Under 1 year Data
Minimum0.041%30.0%
Maximum58.3%100.0%
Range58.3%70.0%
Mean12.5%62.2%
Median7.4%66.2%
Interquartile 25% (IQ1)3.3%53.8%
Interquartile 75% (IQ3)15.5%71.5%
Interquartile Range (IQR)12.2%17.7%
Standard Deviation (Sample)13.7%14.9%
Standard Deviation (Population)13.5%14.7%

Correlation Details

Icelander PercentileSample SizeCollege, Under 1 year
[
0.0%
-
0.5%
]
0.041%
155,078,87667.6%
[
0.0%
-
0.5%
]
0.41%
3,279,05971.6%
[
0.5%
-
1.0%
]
0.74%
704,75167.0%
[
0.5%
-
1.0%
]
1.00%
326,68471.5%
[
1.0%
-
1.5%
]
1.29%
103,35274.7%
[
1.5%
-
2.0%
]
1.59%
63,74770.4%
[
1.5%
-
2.0%
]
1.89%
31,66670.6%
[
2.0%
-
2.5%
]
2.13%
23,39060.7%
[
2.5%
-
3.0%
]
2.51%
7,69957.8%
[
2.5%
-
3.0%
]
2.83%
13,03466.5%
[
3.0%
-
3.5%
]
3.10%
6,03360.2%
[
3.0%
-
3.5%
]
3.30%
1,91149.8%
[
3.5%
-
4.0%
]
3.74%
88253.8%
[
3.5%
-
4.0%
]
3.98%
4,62073.9%
[
4.0%
-
4.5%
]
4.18%
1,48258.9%
[
4.0%
-
4.5%
]
4.45%
2,11348.2%
[
4.5%
-
5.0%
]
4.82%
58160.7%
[
5.0%
-
5.5%
]
5.06%
15867.4%
[
5.0%
-
5.5%
]
5.33%
58240.6%
[
5.5%
-
6.0%
]
5.60%
5,71148.3%
[
6.0%
-
6.5%
]
6.28%
2,35766.6%
[
6.5%
-
7.0%
]
6.95%
56155.4%
[
7.0%
-
7.5%
]
7.05%
22746.9%
[
7.5%
-
8.0%
]
7.82%
1,01065.8%
[
7.5%
-
8.0%
]
7.97%
25163.9%
[
8.5%
-
9.0%
]
8.81%
15941.4%
[
9.0%
-
9.5%
]
9.26%
1,36071.1%
[
10.0%
-
10.5%
]
10.27%
2,44366.9%
[
10.5%
-
11.0%
]
10.79%
27831.5%
[
12.5%
-
13.0%
]
12.82%
19565.2%
[
13.0%
-
13.5%
]
13.40%
20972.2%
[
13.5%
-
14.0%
]
13.89%
21678.1%
[
14.0%
-
14.5%
]
14.29%
3530.0%
[
15.0%
-
15.5%
]
15.00%
2083.3%
[
15.5%
-
16.0%
]
15.51%
18740.1%
[
16.5%
-
17.0%
]
16.57%
175100.0%
[
17.5%
-
18.0%
]
17.61%
35279.8%
[
20.5%
-
21.0%
]
20.90%
24439.7%
[
22.5%
-
23.0%
]
22.80%
53560.8%
[
23.0%
-
23.5%
]
23.39%
21871.1%
[
27.0%
-
27.5%
]
27.37%
17981.6%
[
31.0%
-
31.5%
]
31.48%
95375.4%
[
40.5%
-
41.0%
]
40.91%
15432.6%
[
46.0%
-
46.5%
]
46.15%
3966.7%
[
49.0%
-
49.5%
]
49.34%
22777.3%
[
58.0%
-
58.5%
]
58.33%
6058.6%