Icelander Male Disability
COMPARE
Icelander
Select to Compare
Male Disability
Icelander Male Disability
11.6%
DISABILITY | MALES
10.1/ 100
METRIC RATING
208th/ 347
METRIC RANK
Icelander Male Disability Correlation Chart
The statistical analysis conducted on geographies consisting of 159,644,082 people shows a poor positive correlation between the proportion of Icelanders and percentage of males with a disability in the United States with a correlation coefficient (R) of 0.184 and weighted average of 11.6%. On average, for every 1% (one percent) increase in Icelanders within a typical geography, there is an increase of 0.100% in percentage of males with a disability.
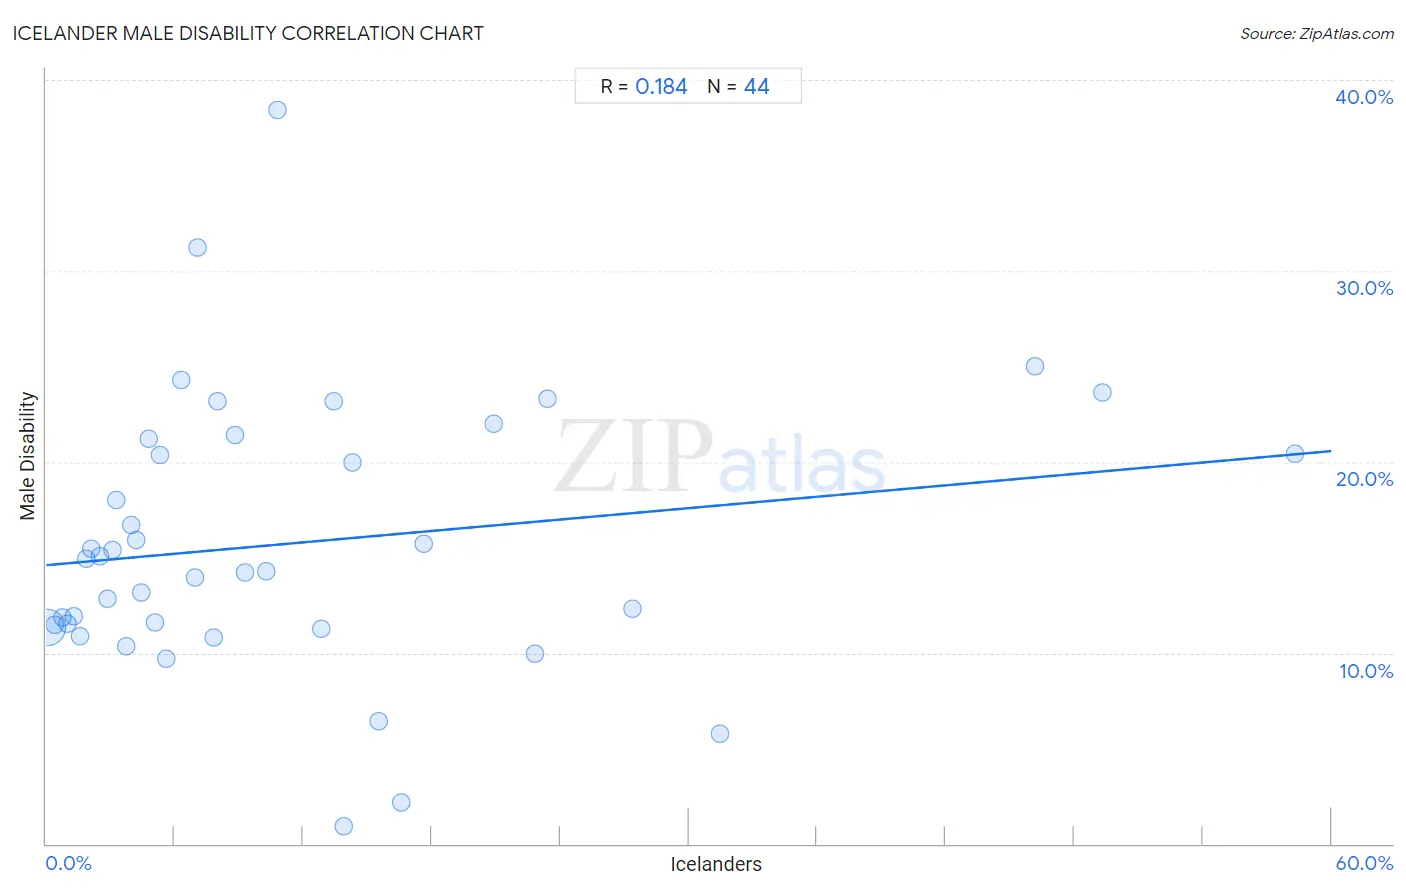
It is essential to understand that the correlation between the percentage of Icelanders and percentage of males with a disability does not imply a direct cause-and-effect relationship. It remains uncertain whether the presence of Icelanders influences an upward or downward trend in the level of percentage of males with a disability within an area, or if Icelanders simply ended up residing in those areas with higher or lower levels of percentage of males with a disability due to other factors.
Demographics Similar to Icelanders by Male Disability
In terms of male disability, the demographic groups most similar to Icelanders are Spanish American Indian (11.6%, a difference of 0.010%), Immigrants from Somalia (11.5%, a difference of 0.040%), Ukrainian (11.5%, a difference of 0.070%), Serbian (11.5%, a difference of 0.080%), and Immigrants from Cambodia (11.5%, a difference of 0.090%).
| Demographics | Rating | Rank | Male Disability |
| Immigrants from Panama | 13.0 /100 | #201 | Poor 11.5% |
| Immigrants from Mexico | 12.6 /100 | #202 | Poor 11.5% |
| Jamaicans | 10.9 /100 | #203 | Poor 11.5% |
| Immigrants from Cambodia | 10.8 /100 | #204 | Poor 11.5% |
| Serbians | 10.7 /100 | #205 | Poor 11.5% |
| Ukrainians | 10.6 /100 | #206 | Poor 11.5% |
| Immigrants from Somalia | 10.4 /100 | #207 | Poor 11.5% |
| Icelanders | 10.1 /100 | #208 | Poor 11.6% |
| Spanish American Indians | 10.1 /100 | #209 | Poor 11.6% |
| Ute | 9.4 /100 | #210 | Tragic 11.6% |
| Immigrants from Thailand | 8.4 /100 | #211 | Tragic 11.6% |
| Immigrants from Scotland | 8.2 /100 | #212 | Tragic 11.6% |
| Mexican American Indians | 7.8 /100 | #213 | Tragic 11.6% |
| Lithuanians | 6.6 /100 | #214 | Tragic 11.6% |
| Indonesians | 5.9 /100 | #215 | Tragic 11.6% |
Icelander Male Disability Correlation Summary
| Measurement | Icelander Data | Male Disability Data |
| Minimum | 0.041% | 0.92% |
| Maximum | 58.3% | 38.5% |
| Range | 58.3% | 37.5% |
| Mean | 11.8% | 15.8% |
| Median | 7.0% | 14.6% |
| Interquartile 25% (IQ1) | 3.2% | 11.4% |
| Interquartile 75% (IQ3) | 14.9% | 20.8% |
| Interquartile Range (IQR) | 11.7% | 9.4% |
| Standard Deviation (Sample) | 13.3% | 7.2% |
| Standard Deviation (Population) | 13.1% | 7.1% |
Correlation Details
| Icelander Percentile | Sample Size | Male Disability |
[ 0.0% - 0.5% ] 0.041% | 155,065,390 | 11.4% |
[ 0.0% - 0.5% ] 0.41% | 3,268,441 | 11.4% |
[ 0.5% - 1.0% ] 0.74% | 704,751 | 11.9% |
[ 0.5% - 1.0% ] 1.00% | 326,684 | 11.5% |
[ 1.0% - 1.5% ] 1.29% | 103,352 | 11.9% |
[ 1.5% - 2.0% ] 1.59% | 63,747 | 10.9% |
[ 1.5% - 2.0% ] 1.89% | 31,507 | 15.0% |
[ 2.0% - 2.5% ] 2.13% | 23,390 | 15.4% |
[ 2.5% - 3.0% ] 2.51% | 7,699 | 15.0% |
[ 2.5% - 3.0% ] 2.84% | 12,619 | 12.8% |
[ 3.0% - 3.5% ] 3.10% | 6,033 | 15.4% |
[ 3.0% - 3.5% ] 3.30% | 1,911 | 18.0% |
[ 3.5% - 4.0% ] 3.74% | 882 | 10.4% |
[ 3.5% - 4.0% ] 3.98% | 4,620 | 16.7% |
[ 4.0% - 4.5% ] 4.18% | 1,482 | 15.9% |
[ 4.0% - 4.5% ] 4.45% | 2,113 | 13.2% |
[ 4.5% - 5.0% ] 4.81% | 540 | 21.2% |
[ 5.0% - 5.5% ] 5.06% | 158 | 11.6% |
[ 5.0% - 5.5% ] 5.33% | 582 | 20.4% |
[ 5.5% - 6.0% ] 5.60% | 5,711 | 9.7% |
[ 6.0% - 6.5% ] 6.28% | 2,357 | 24.3% |
[ 6.5% - 7.0% ] 6.95% | 561 | 13.9% |
[ 7.0% - 7.5% ] 7.05% | 227 | 31.2% |
[ 7.5% - 8.0% ] 7.82% | 1,010 | 10.8% |
[ 7.5% - 8.0% ] 7.97% | 251 | 23.2% |
[ 8.5% - 9.0% ] 8.81% | 159 | 21.4% |
[ 9.0% - 9.5% ] 9.26% | 1,360 | 14.2% |
[ 10.0% - 10.5% ] 10.27% | 2,443 | 14.3% |
[ 10.5% - 11.0% ] 10.79% | 278 | 38.5% |
[ 12.5% - 13.0% ] 12.82% | 195 | 11.3% |
[ 13.0% - 13.5% ] 13.40% | 209 | 23.1% |
[ 13.5% - 14.0% ] 13.89% | 216 | 0.92% |
[ 14.0% - 14.5% ] 14.29% | 35 | 20.0% |
[ 15.5% - 16.0% ] 15.51% | 187 | 6.4% |
[ 16.5% - 17.0% ] 16.57% | 175 | 2.1% |
[ 17.5% - 18.0% ] 17.61% | 352 | 15.7% |
[ 20.5% - 21.0% ] 20.90% | 244 | 22.0% |
[ 22.5% - 23.0% ] 22.80% | 535 | 10.0% |
[ 23.0% - 23.5% ] 23.39% | 218 | 23.3% |
[ 27.0% - 27.5% ] 27.37% | 179 | 12.3% |
[ 31.0% - 31.5% ] 31.48% | 953 | 5.8% |
[ 46.0% - 46.5% ] 46.15% | 39 | 25.0% |
[ 49.0% - 49.5% ] 49.34% | 227 | 23.6% |
[ 58.0% - 58.5% ] 58.33% | 60 | 20.5% |