Icelander Disability

COMPARE

Icelander
Race
Ancestry
AfghanAfricanAlaska NativeAlaskan AthabascanAlbanianAleutAlsatianAmericanApacheArabArapahoArgentineanArmenianAssyrian/Chaldean/SyriacAustralianAustrianBahamianBangladeshiBarbadianBasqueBelgianBelizeanBermudanBhutaneseBlackfeetBolivianBrazilianBritishBritish West IndianBulgarianBurmeseCajunCambodianCanadianCape VerdeanCarpatho RusynCelticCentral AmericanCentral American IndianCherokeeCheyenneChickasawChileanChineseChippewaChoctawColombianColvilleComancheCosta RicanCreeCreekCroatianCrowCubanCypriotCzechCzechoslovakianDanishDelawareDominicanDutchDutch West IndianEastern EuropeanEcuadorianEgyptianEnglishEstonianEthiopianEuropeanFijianFilipinoFinnishFrenchFrench American IndianFrench CanadianGermanGerman RussianGhanaianGreekGuamanian/ChamorroGuatemalanGuyaneseHaitianHmongHonduranHopiHoumaHungarianIcelanderIndian (Asian)IndonesianInupiatIranianIraqiIrishIroquoisIsraeliItalianJamaicanJapaneseJordanianKenyanKiowaKoreanLaotianLatvianLebaneseLiberianLithuanianLumbeeLuxembourgerMacedonianMalaysianMalteseMarshalleseMenomineeMexicanMexican American IndianMongolianMoroccanNative HawaiianNavajoNepaleseNew ZealanderNicaraguanNigerianNorthern EuropeanNorwegianOkinawanOsageOttawaPaiutePakistaniPalestinianPanamanianParaguayanPennsylvania GermanPeruvianPimaPolishPortuguesePotawatomiPuebloPuerto RicanPuget Sound SalishRomanianRussianSalvadoranSamoanScandinavianScotch-IrishScottishSeminoleSenegaleseSerbianShoshoneSierra LeoneanSiouxSlavicSlovakSloveneSomaliSouth AfricanSouth AmericanSouth American IndianSoviet UnionSpaniardSpanishSpanish AmericanSpanish American IndianSri LankanSubsaharan AfricanSudaneseSwedishSwissSyrianTaiwaneseThaiTlingit-HaidaTohono O'OdhamTonganTrinidadian and TobagonianTsimshianTurkishU.S. Virgin IslanderUgandanUkrainianUruguayanUteVenezuelanVietnameseWelshWest IndianYakamaYaquiYugoslavianYumanYup'ikZimbabwean
Immigration
NonimmigrantsImmigrantsAfghanistanAfricaAlbaniaArgentinaArmeniaAsiaAustraliaAustriaBahamasBangladeshBarbadosBelarusBelgiumBelizeBoliviaBosnia and HerzegovinaBrazilBulgariaBurma/MyanmarCabo VerdeCambodiaCameroonCanadaCaribbeanCentral AmericaChileChinaColombiaCongoCosta RicaCroatiaCubaCzechoslovakiaDenmarkDominicaDominican RepublicEastern AfricaEastern AsiaEastern EuropeEcuadorEgyptEl SalvadorEnglandEritreaEthiopiaEuropeFijiFranceGermanyGhanaGreeceGrenadaGuatemalaGuyanaHaitiHondurasHong KongHungaryIndiaIndonesiaIranIraqIrelandIsraelItalyJamaicaJapanJordanKazakhstanKenyaKoreaKuwaitLaosLatin AmericaLatviaLebanonLiberiaLithuaniaMalaysiaMexicoMicronesiaMiddle AfricaMoldovaMoroccoNepalNetherlandsNicaraguaNigeriaNorth AmericaNorth MacedoniaNorthern AfricaNorthern EuropeNorwayOceaniaPakistanPanamaPeruPhilippinesPolandPortugalRomaniaRussiaSaudi ArabiaScotlandSenegalSerbiaSierra LeoneSingaporeSomaliaSouth AfricaSouth AmericaSouth Central AsiaSouth Eastern AsiaSouthern EuropeSpainSri LankaSt. Vincent and the GrenadinesSudanSwedenSwitzerlandSyriaTaiwanThailandTrinidad and TobagoTurkeyUgandaUkraineUruguayUzbekistanVenezuelaVietnamWest IndiesWestern AfricaWestern AsiaWestern EuropeYemenZaireZimbabweAzores
Select to Compare
Race
Ancestry
AfghanAfricanAlaska NativeAlaskan AthabascanAlbanianAleutAlsatianAmericanApacheArabArapahoArgentineanArmenianAssyrian/Chaldean/SyriacAustralianAustrianBahamianBangladeshiBarbadianBasqueBelgianBelizeanBermudanBhutaneseBlackfeetBolivianBrazilianBritishBritish West IndianBulgarianBurmeseCajunCambodianCanadianCape VerdeanCarpatho RusynCelticCentral AmericanCentral American IndianCherokeeCheyenneChickasawChileanChineseChippewaChoctawColombianColvilleComancheCosta RicanCreeCreekCroatianCrowCubanCypriotCzechCzechoslovakianDanishDelawareDominicanDutchDutch West IndianEastern EuropeanEcuadorianEgyptianEnglishEstonianEthiopianEuropeanFijianFilipinoFinnishFrenchFrench American IndianFrench CanadianGermanGerman RussianGhanaianGreekGuamanian/ChamorroGuatemalanGuyaneseHaitianHmongHonduranHopiHoumaHungarianIndian (Asian)IndonesianInupiatIranianIraqiIrishIroquoisIsraeliItalianJamaicanJapaneseJordanianKenyanKiowaKoreanLaotianLatvianLebaneseLiberianLithuanianLumbeeLuxembourgerMacedonianMalaysianMalteseMarshalleseMenomineeMexicanMexican American IndianMongolianMoroccanNative HawaiianNavajoNepaleseNew ZealanderNicaraguanNigerianNorthern EuropeanNorwegianOkinawanOsageOttawaPaiutePakistaniPalestinianPanamanianParaguayanPennsylvania GermanPeruvianPimaPolishPortuguesePotawatomiPuebloPuerto RicanPuget Sound SalishRomanianRussianSalvadoranSamoanScandinavianScotch-IrishScottishSeminoleSenegaleseSerbianShoshoneSierra LeoneanSiouxSlavicSlovakSloveneSomaliSouth AfricanSouth AmericanSouth American IndianSoviet UnionSpaniardSpanishSpanish AmericanSpanish American IndianSri LankanSubsaharan AfricanSudaneseSwedishSwissSyrianTaiwaneseThaiTlingit-HaidaTohono O'OdhamTonganTrinidadian and TobagonianTsimshianTurkishU.S. Virgin IslanderUgandanUkrainianUruguayanUteVenezuelanVietnameseWelshWest IndianYakamaYaquiYugoslavianYumanYup'ikZimbabwean
Immigration
NonimmigrantsImmigrantsAfghanistanAfricaAlbaniaArgentinaArmeniaAsiaAustraliaAustriaBahamasBangladeshBarbadosBelarusBelgiumBelizeBoliviaBosnia and HerzegovinaBrazilBulgariaBurma/MyanmarCabo VerdeCambodiaCameroonCanadaCaribbeanCentral AmericaChileChinaColombiaCongoCosta RicaCroatiaCubaCzechoslovakiaDenmarkDominicaDominican RepublicEastern AfricaEastern AsiaEastern EuropeEcuadorEgyptEl SalvadorEnglandEritreaEthiopiaEuropeFijiFranceGermanyGhanaGreeceGrenadaGuatemalaGuyanaHaitiHondurasHong KongHungaryIndiaIndonesiaIranIraqIrelandIsraelItalyJamaicaJapanJordanKazakhstanKenyaKoreaKuwaitLaosLatin AmericaLatviaLebanonLiberiaLithuaniaMalaysiaMexicoMicronesiaMiddle AfricaMoldovaMoroccoNepalNetherlandsNicaraguaNigeriaNorth AmericaNorth MacedoniaNorthern AfricaNorthern EuropeNorwayOceaniaPakistanPanamaPeruPhilippinesPolandPortugalRomaniaRussiaSaudi ArabiaScotlandSenegalSerbiaSierra LeoneSingaporeSomaliaSouth AfricaSouth AmericaSouth Central AsiaSouth Eastern AsiaSouthern EuropeSpainSri LankaSt. Vincent and the GrenadinesSudanSwedenSwitzerlandSyriaTaiwanThailandTrinidad and TobagoTurkeyUgandaUkraineUruguayUzbekistanVenezuelaVietnamWest IndiesWestern AfricaWestern AsiaWestern EuropeYemenZaireZimbabweAzores
Disability
Income
Poverty
Unemployment
Labor Participation
Family Structure
Vehicle Availability
Education Level
Disability

Icelander Disability
Fair

11.8%
DISABILITY
34.0/ 100
METRIC RATING
182nd/ 347
METRIC RANK

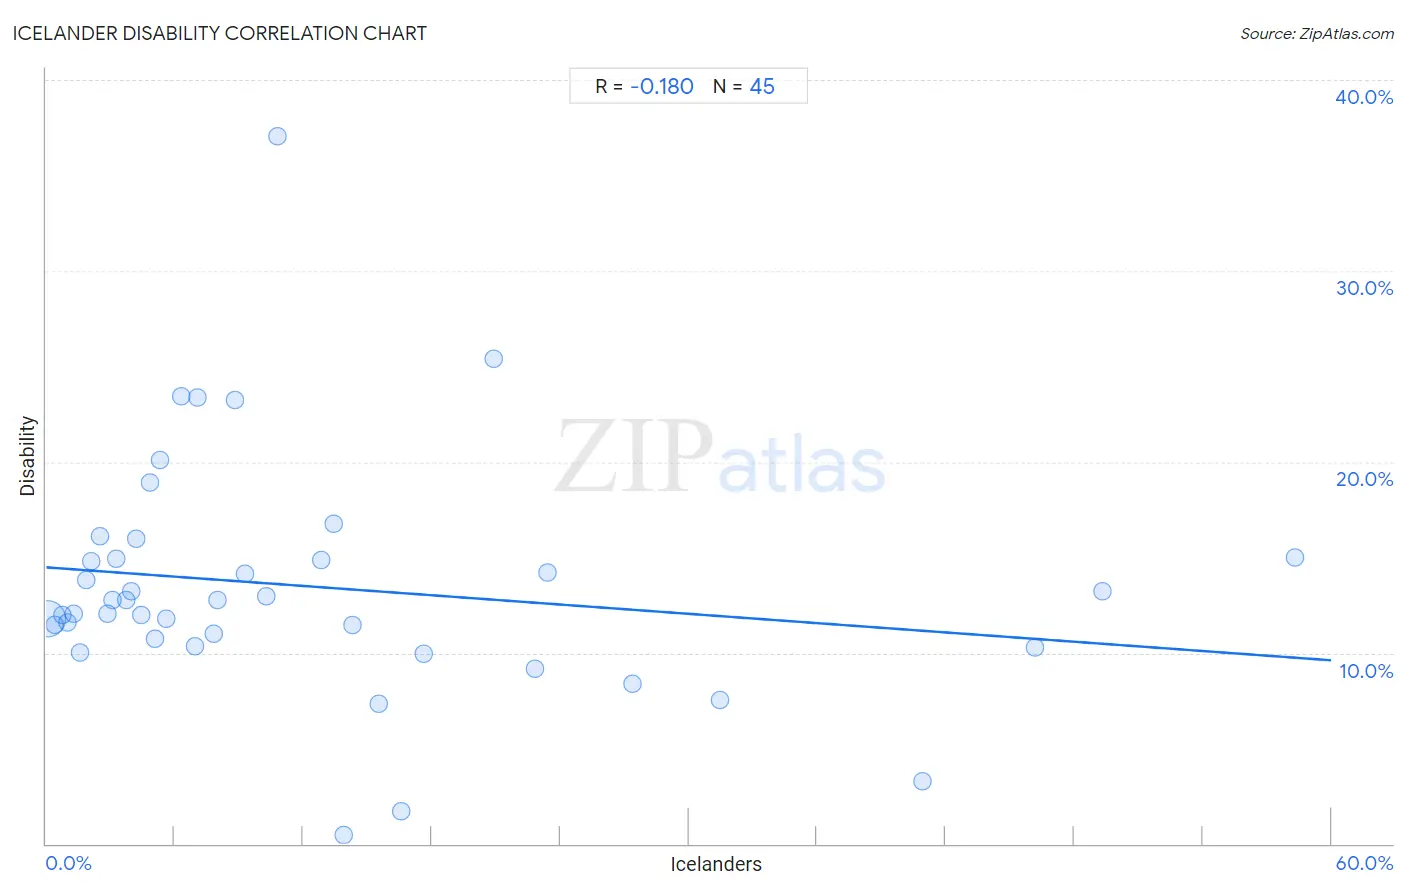
Icelander Disability Correlation Chart

The statistical analysis conducted on geographies consisting of 159,644,692 people shows a poor negative correlation between the proportion of Icelanders and percentage of population with a disability in the United States with a correlation coefficient (R) of -0.180 and weighted average of 11.8%. On average, for every 1% (one percent) increase in Icelanders within a typical geography, there is a decrease of 0.081% in percentage of population with a disability.
Icelander Disability
It is essential to understand that the correlation between the percentage of Icelanders and percentage of population with a disability does not imply a direct cause-and-effect relationship. It remains uncertain whether the presence of Icelanders influences an upward or downward trend in the level of percentage of population with a disability within an area, or if Icelanders simply ended up residing in those areas with higher or lower levels of percentage of population with a disability due to other factors.

Demographics Similar to Icelanders by Disability

In terms of disability, the demographic groups most similar to Icelanders are Immigrants from Oceania (11.8%, a difference of 0.010%), Honduran (11.8%, a difference of 0.14%), Immigrants from Honduras (11.8%, a difference of 0.19%), Iraqi (11.8%, a difference of 0.20%), and Immigrants from Burma/Myanmar (11.8%, a difference of 0.28%).
DemographicsRating | RankDisability
Haitians
48.6
/100
|
#175
Average
11.7%
Immigrants from Western Africa
47.5
/100
|
#176
Average
11.7%
Immigrants from Central America
46.6
/100
|
#177
Average
11.7%
Greeks
46.2
/100
|
#178
Average
11.7%
Immigrants from Armenia
41.9
/100
|
#179
Average
11.7%
Immigrants from Honduras
37.8
/100
|
#180
Fair
11.8%
Immigrants from Oceania
34.3
/100
|
#181
Fair
11.8%
Icelanders
34.0
/100
|
#182
Fair
11.8%
Hondurans
31.2
/100
|
#183
Fair
11.8%
Iraqis
30.0
/100
|
#184
Fair
11.8%
Immigrants from Burma/Myanmar
28.5
/100
|
#185
Fair
11.8%
Immigrants from Scotland
28.2
/100
|
#186
Fair
11.8%
Lebanese
27.9
/100
|
#187
Fair
11.8%
Immigrants from Mexico
23.8
/100
|
#188
Fair
11.9%
Immigrants from Zaire
21.8
/100
|
#189
Fair
11.9%

Icelander Disability Correlation Summary

MeasurementIcelander DataDisability Data
Minimum0.041%0.46%
Maximum58.3%37.1%
Range58.3%36.6%
Mean12.4%13.5%
Median7.0%12.7%
Interquartile 25% (IQ1)3.2%10.5%
Interquartile 75% (IQ3)16.0%15.0%
Interquartile Range (IQR)12.8%4.4%
Standard Deviation (Sample)13.8%6.2%
Standard Deviation (Population)13.7%6.2%

Correlation Details

Icelander PercentileSample SizeDisability
[
0.0%
-
0.5%
]
0.041%
155,065,39011.8%
[
0.0%
-
0.5%
]
0.41%
3,268,44111.5%
[
0.5%
-
1.0%
]
0.74%
704,75112.0%
[
0.5%
-
1.0%
]
1.00%
326,68411.6%
[
1.0%
-
1.5%
]
1.29%
103,35212.0%
[
1.5%
-
2.0%
]
1.59%
63,74710.0%
[
1.5%
-
2.0%
]
1.89%
31,50713.8%
[
2.0%
-
2.5%
]
2.13%
23,39014.8%
[
2.5%
-
3.0%
]
2.51%
7,69916.1%
[
2.5%
-
3.0%
]
2.83%
13,03412.0%
[
3.0%
-
3.5%
]
3.10%
6,03312.7%
[
3.0%
-
3.5%
]
3.30%
1,91114.9%
[
3.5%
-
4.0%
]
3.74%
88212.8%
[
3.5%
-
4.0%
]
3.98%
4,62013.2%
[
4.0%
-
4.5%
]
4.18%
1,48216.0%
[
4.0%
-
4.5%
]
4.45%
2,11312.0%
[
4.5%
-
5.0%
]
4.82%
58118.9%
[
5.0%
-
5.5%
]
5.06%
15810.8%
[
5.0%
-
5.5%
]
5.33%
58220.1%
[
5.5%
-
6.0%
]
5.60%
5,71111.8%
[
6.0%
-
6.5%
]
6.28%
2,35723.4%
[
6.5%
-
7.0%
]
6.95%
56110.3%
[
7.0%
-
7.5%
]
7.05%
22723.3%
[
7.5%
-
8.0%
]
7.82%
1,01011.0%
[
7.5%
-
8.0%
]
7.97%
25112.8%
[
8.5%
-
9.0%
]
8.81%
15923.3%
[
9.0%
-
9.5%
]
9.26%
1,36014.1%
[
10.0%
-
10.5%
]
10.27%
2,44313.0%
[
10.5%
-
11.0%
]
10.79%
27837.1%
[
12.5%
-
13.0%
]
12.82%
19514.9%
[
13.0%
-
13.5%
]
13.40%
20916.7%
[
13.5%
-
14.0%
]
13.89%
2160.46%
[
14.0%
-
14.5%
]
14.29%
3511.4%
[
15.5%
-
16.0%
]
15.51%
1877.3%
[
16.5%
-
17.0%
]
16.57%
1751.7%
[
17.5%
-
18.0%
]
17.61%
3529.9%
[
20.5%
-
21.0%
]
20.90%
24425.4%
[
22.5%
-
23.0%
]
22.80%
5359.2%
[
23.0%
-
23.5%
]
23.39%
21814.2%
[
27.0%
-
27.5%
]
27.37%
1798.4%
[
31.0%
-
31.5%
]
31.48%
9537.6%
[
40.5%
-
41.0%
]
40.91%
1543.2%
[
46.0%
-
46.5%
]
46.15%
3910.3%
[
49.0%
-
49.5%
]
49.34%
22713.2%
[
58.0%
-
58.5%
]
58.33%
6015.0%