Icelander Married-couple Households

COMPARE

Icelander
Race
Ancestry
AfghanAfricanAlaska NativeAlaskan AthabascanAlbanianAleutAlsatianAmericanApacheArabArapahoArgentineanArmenianAssyrian/Chaldean/SyriacAustralianAustrianBahamianBangladeshiBarbadianBasqueBelgianBelizeanBermudanBhutaneseBlackfeetBolivianBrazilianBritishBritish West IndianBulgarianBurmeseCajunCambodianCanadianCape VerdeanCarpatho RusynCelticCentral AmericanCentral American IndianCherokeeCheyenneChickasawChileanChineseChippewaChoctawColombianColvilleComancheCosta RicanCreeCreekCroatianCrowCubanCypriotCzechCzechoslovakianDanishDelawareDominicanDutchDutch West IndianEastern EuropeanEcuadorianEgyptianEnglishEstonianEthiopianEuropeanFijianFilipinoFinnishFrenchFrench American IndianFrench CanadianGermanGerman RussianGhanaianGreekGuamanian/ChamorroGuatemalanGuyaneseHaitianHmongHonduranHopiHoumaHungarianIcelanderIndian (Asian)IndonesianInupiatIranianIraqiIrishIroquoisIsraeliItalianJamaicanJapaneseJordanianKenyanKiowaKoreanLaotianLatvianLebaneseLiberianLithuanianLumbeeLuxembourgerMacedonianMalaysianMalteseMarshalleseMenomineeMexicanMexican American IndianMongolianMoroccanNative HawaiianNavajoNepaleseNew ZealanderNicaraguanNigerianNorthern EuropeanNorwegianOkinawanOsageOttawaPaiutePakistaniPalestinianPanamanianParaguayanPennsylvania GermanPeruvianPimaPolishPortuguesePotawatomiPuebloPuerto RicanPuget Sound SalishRomanianRussianSalvadoranSamoanScandinavianScotch-IrishScottishSeminoleSenegaleseSerbianShoshoneSierra LeoneanSiouxSlavicSlovakSloveneSomaliSouth AfricanSouth AmericanSouth American IndianSoviet UnionSpaniardSpanishSpanish AmericanSpanish American IndianSri LankanSubsaharan AfricanSudaneseSwedishSwissSyrianTaiwaneseThaiTlingit-HaidaTohono O'OdhamTonganTrinidadian and TobagonianTsimshianTurkishU.S. Virgin IslanderUgandanUkrainianUruguayanUteVenezuelanVietnameseWelshWest IndianYakamaYaquiYugoslavianYumanYup'ikZimbabwean
Immigration
NonimmigrantsImmigrantsAfghanistanAfricaAlbaniaArgentinaArmeniaAsiaAustraliaAustriaBahamasBangladeshBarbadosBelarusBelgiumBelizeBoliviaBosnia and HerzegovinaBrazilBulgariaBurma/MyanmarCabo VerdeCambodiaCameroonCanadaCaribbeanCentral AmericaChileChinaColombiaCongoCosta RicaCroatiaCubaCzechoslovakiaDenmarkDominicaDominican RepublicEastern AfricaEastern AsiaEastern EuropeEcuadorEgyptEl SalvadorEnglandEritreaEthiopiaEuropeFijiFranceGermanyGhanaGreeceGrenadaGuatemalaGuyanaHaitiHondurasHong KongHungaryIndiaIndonesiaIranIraqIrelandIsraelItalyJamaicaJapanJordanKazakhstanKenyaKoreaKuwaitLaosLatin AmericaLatviaLebanonLiberiaLithuaniaMalaysiaMexicoMicronesiaMiddle AfricaMoldovaMoroccoNepalNetherlandsNicaraguaNigeriaNorth AmericaNorth MacedoniaNorthern AfricaNorthern EuropeNorwayOceaniaPakistanPanamaPeruPhilippinesPolandPortugalRomaniaRussiaSaudi ArabiaScotlandSenegalSerbiaSierra LeoneSingaporeSomaliaSouth AfricaSouth AmericaSouth Central AsiaSouth Eastern AsiaSouthern EuropeSpainSri LankaSt. Vincent and the GrenadinesSudanSwedenSwitzerlandSyriaTaiwanThailandTrinidad and TobagoTurkeyUgandaUkraineUruguayUzbekistanVenezuelaVietnamWest IndiesWestern AfricaWestern AsiaWestern EuropeYemenZaireZimbabweAzores
Select to Compare
Race
Ancestry
AfghanAfricanAlaska NativeAlaskan AthabascanAlbanianAleutAlsatianAmericanApacheArabArapahoArgentineanArmenianAssyrian/Chaldean/SyriacAustralianAustrianBahamianBangladeshiBarbadianBasqueBelgianBelizeanBermudanBhutaneseBlackfeetBolivianBrazilianBritishBritish West IndianBulgarianBurmeseCajunCambodianCanadianCape VerdeanCarpatho RusynCelticCentral AmericanCentral American IndianCherokeeCheyenneChickasawChileanChineseChippewaChoctawColombianColvilleComancheCosta RicanCreeCreekCroatianCrowCubanCypriotCzechCzechoslovakianDanishDelawareDominicanDutchDutch West IndianEastern EuropeanEcuadorianEgyptianEnglishEstonianEthiopianEuropeanFijianFilipinoFinnishFrenchFrench American IndianFrench CanadianGermanGerman RussianGhanaianGreekGuamanian/ChamorroGuatemalanGuyaneseHaitianHmongHonduranHopiHoumaHungarianIndian (Asian)IndonesianInupiatIranianIraqiIrishIroquoisIsraeliItalianJamaicanJapaneseJordanianKenyanKiowaKoreanLaotianLatvianLebaneseLiberianLithuanianLumbeeLuxembourgerMacedonianMalaysianMalteseMarshalleseMenomineeMexicanMexican American IndianMongolianMoroccanNative HawaiianNavajoNepaleseNew ZealanderNicaraguanNigerianNorthern EuropeanNorwegianOkinawanOsageOttawaPaiutePakistaniPalestinianPanamanianParaguayanPennsylvania GermanPeruvianPimaPolishPortuguesePotawatomiPuebloPuerto RicanPuget Sound SalishRomanianRussianSalvadoranSamoanScandinavianScotch-IrishScottishSeminoleSenegaleseSerbianShoshoneSierra LeoneanSiouxSlavicSlovakSloveneSomaliSouth AfricanSouth AmericanSouth American IndianSoviet UnionSpaniardSpanishSpanish AmericanSpanish American IndianSri LankanSubsaharan AfricanSudaneseSwedishSwissSyrianTaiwaneseThaiTlingit-HaidaTohono O'OdhamTonganTrinidadian and TobagonianTsimshianTurkishU.S. Virgin IslanderUgandanUkrainianUruguayanUteVenezuelanVietnameseWelshWest IndianYakamaYaquiYugoslavianYumanYup'ikZimbabwean
Immigration
NonimmigrantsImmigrantsAfghanistanAfricaAlbaniaArgentinaArmeniaAsiaAustraliaAustriaBahamasBangladeshBarbadosBelarusBelgiumBelizeBoliviaBosnia and HerzegovinaBrazilBulgariaBurma/MyanmarCabo VerdeCambodiaCameroonCanadaCaribbeanCentral AmericaChileChinaColombiaCongoCosta RicaCroatiaCubaCzechoslovakiaDenmarkDominicaDominican RepublicEastern AfricaEastern AsiaEastern EuropeEcuadorEgyptEl SalvadorEnglandEritreaEthiopiaEuropeFijiFranceGermanyGhanaGreeceGrenadaGuatemalaGuyanaHaitiHondurasHong KongHungaryIndiaIndonesiaIranIraqIrelandIsraelItalyJamaicaJapanJordanKazakhstanKenyaKoreaKuwaitLaosLatin AmericaLatviaLebanonLiberiaLithuaniaMalaysiaMexicoMicronesiaMiddle AfricaMoldovaMoroccoNepalNetherlandsNicaraguaNigeriaNorth AmericaNorth MacedoniaNorthern AfricaNorthern EuropeNorwayOceaniaPakistanPanamaPeruPhilippinesPolandPortugalRomaniaRussiaSaudi ArabiaScotlandSenegalSerbiaSierra LeoneSingaporeSomaliaSouth AfricaSouth AmericaSouth Central AsiaSouth Eastern AsiaSouthern EuropeSpainSri LankaSt. Vincent and the GrenadinesSudanSwedenSwitzerlandSyriaTaiwanThailandTrinidad and TobagoTurkeyUgandaUkraineUruguayUzbekistanVenezuelaVietnamWest IndiesWestern AfricaWestern AsiaWestern EuropeYemenZaireZimbabweAzores
Married-couple Households
Income
Poverty
Unemployment
Labor Participation
Family Structure
Vehicle Availability
Education Level
Disability

Icelander Married-couple Households
Good

47.0%
MARRIED-COUPLE HOUSEHOLDS
79.5/ 100
METRIC RATING
148th/ 347
METRIC RANK

Icelander Married-couple Households Correlation Chart

The statistical analysis conducted on geographies consisting of 159,619,333 people shows a weak positive correlation between the proportion of Icelanders and percentage of married-couple family households in the United States with a correlation coefficient (R) of 0.238 and weighted average of 47.0%. On average, for every 1% (one percent) increase in Icelanders within a typical geography, there is an increase of 0.28% in percentage of married-couple family households.
Icelander Married-couple Households
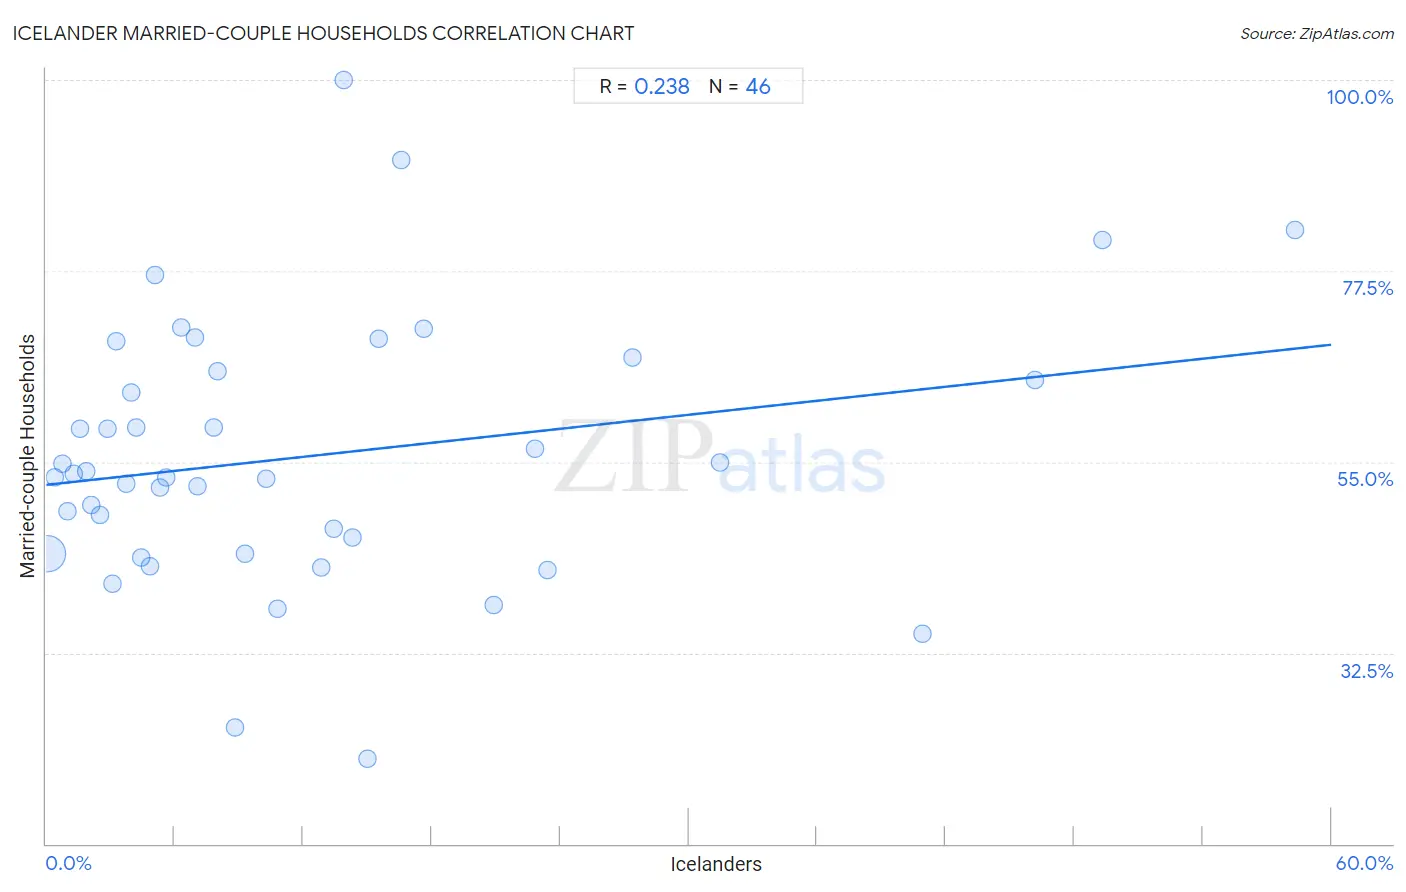
It is essential to understand that the correlation between the percentage of Icelanders and percentage of married-couple family households does not imply a direct cause-and-effect relationship. It remains uncertain whether the presence of Icelanders influences an upward or downward trend in the level of percentage of married-couple family households within an area, or if Icelanders simply ended up residing in those areas with higher or lower levels of percentage of married-couple family households due to other factors.

Demographics Similar to Icelanders by Married-couple Households

In terms of married-couple households, the demographic groups most similar to Icelanders are Paraguayan (47.0%, a difference of 0.050%), Immigrants from Russia (47.0%, a difference of 0.10%), Immigrants from Syria (47.1%, a difference of 0.12%), Slovene (47.1%, a difference of 0.13%), and Immigrants from Western Europe (47.1%, a difference of 0.13%).
DemographicsRating | RankMarried-couple Households
Costa Ricans
84.4
/100
|
#141
Excellent
47.2%
Spaniards
84.1
/100
|
#142
Excellent
47.2%
Immigrants from Belarus
83.8
/100
|
#143
Excellent
47.2%
Mexicans
83.4
/100
|
#144
Excellent
47.1%
Slovenes
81.7
/100
|
#145
Excellent
47.1%
Immigrants from Western Europe
81.6
/100
|
#146
Excellent
47.1%
Immigrants from Syria
81.6
/100
|
#147
Excellent
47.1%
Icelanders
79.5
/100
|
#148
Good
47.0%
Paraguayans
78.7
/100
|
#149
Good
47.0%
Immigrants from Russia
77.6
/100
|
#150
Good
47.0%
Immigrants from Bulgaria
76.8
/100
|
#151
Good
47.0%
Serbians
76.3
/100
|
#152
Good
47.0%
Hmong
76.2
/100
|
#153
Good
47.0%
Immigrants from Western Asia
76.1
/100
|
#154
Good
46.9%
Arabs
76.0
/100
|
#155
Good
46.9%

Icelander Married-couple Households Correlation Summary

MeasurementIcelander DataMarried-couple Households Data
Minimum0.041%20.0%
Maximum58.3%100.0%
Range58.3%80.0%
Mean12.5%55.7%
Median7.4%53.4%
Interquartile 25% (IQ1)3.3%44.1%
Interquartile 75% (IQ3)15.5%65.7%
Interquartile Range (IQR)12.2%21.5%
Standard Deviation (Sample)13.7%15.9%
Standard Deviation (Population)13.5%15.7%

Correlation Details

Icelander PercentileSample SizeMarried-couple Households
[
0.0%
-
0.5%
]
0.041%
155,043,65544.1%
[
0.0%
-
0.5%
]
0.41%
3,265,46553.2%
[
0.5%
-
1.0%
]
0.74%
704,09454.8%
[
0.5%
-
1.0%
]
1.00%
326,68449.2%
[
1.0%
-
1.5%
]
1.29%
103,35253.6%
[
1.5%
-
2.0%
]
1.59%
63,74759.0%
[
1.5%
-
2.0%
]
1.89%
31,50753.9%
[
2.0%
-
2.5%
]
2.13%
23,39050.0%
[
2.5%
-
3.0%
]
2.51%
7,69948.8%
[
2.5%
-
3.0%
]
2.83%
13,03458.9%
[
3.0%
-
3.5%
]
3.10%
6,03340.7%
[
3.0%
-
3.5%
]
3.30%
1,91169.3%
[
3.5%
-
4.0%
]
3.74%
88252.4%
[
3.5%
-
4.0%
]
3.98%
4,62063.1%
[
4.0%
-
4.5%
]
4.18%
1,48259.0%
[
4.0%
-
4.5%
]
4.45%
2,11343.7%
[
4.5%
-
5.0%
]
4.82%
58142.7%
[
5.0%
-
5.5%
]
5.06%
15877.0%
[
5.0%
-
5.5%
]
5.33%
58252.0%
[
5.5%
-
6.0%
]
5.60%
5,71153.2%
[
6.0%
-
6.5%
]
6.28%
2,35770.8%
[
6.5%
-
7.0%
]
6.95%
56169.6%
[
7.0%
-
7.5%
]
7.05%
22752.1%
[
7.5%
-
8.0%
]
7.82%
1,01059.1%
[
7.5%
-
8.0%
]
7.97%
25165.7%
[
8.5%
-
9.0%
]
8.81%
15923.7%
[
9.0%
-
9.5%
]
9.26%
1,36044.1%
[
10.0%
-
10.5%
]
10.27%
2,44353.0%
[
10.5%
-
11.0%
]
10.79%
27837.7%
[
12.5%
-
13.0%
]
12.82%
19542.6%
[
13.0%
-
13.5%
]
13.40%
20947.1%
[
13.5%
-
14.0%
]
13.89%
216100.0%
[
14.0%
-
14.5%
]
14.29%
3546.2%
[
15.0%
-
15.5%
]
15.00%
2020.0%
[
15.5%
-
16.0%
]
15.51%
18769.4%
[
16.5%
-
17.0%
]
16.57%
17590.6%
[
17.5%
-
18.0%
]
17.61%
35270.6%
[
20.5%
-
21.0%
]
20.90%
24438.1%
[
22.5%
-
23.0%
]
22.80%
53556.6%
[
23.0%
-
23.5%
]
23.39%
21842.3%
[
27.0%
-
27.5%
]
27.38%
16867.3%
[
31.0%
-
31.5%
]
31.48%
95354.9%
[
40.5%
-
41.0%
]
40.91%
15434.7%
[
46.0%
-
46.5%
]
46.15%
3964.7%
[
49.0%
-
49.5%
]
49.34%
22781.1%
[
58.0%
-
58.5%
]
58.33%
6082.4%