Assyrian/Chaldean/Syriac Single Mother Poverty
COMPARE
Assyrian/Chaldean/Syriac
Select to Compare
Single Mother Poverty
Assyrian/Chaldean/Syriac Single Mother Poverty
23.8%
POVERTY | SINGLE MOTHERS
100.0/ 100
METRIC RATING
1st/ 347
METRIC RANK
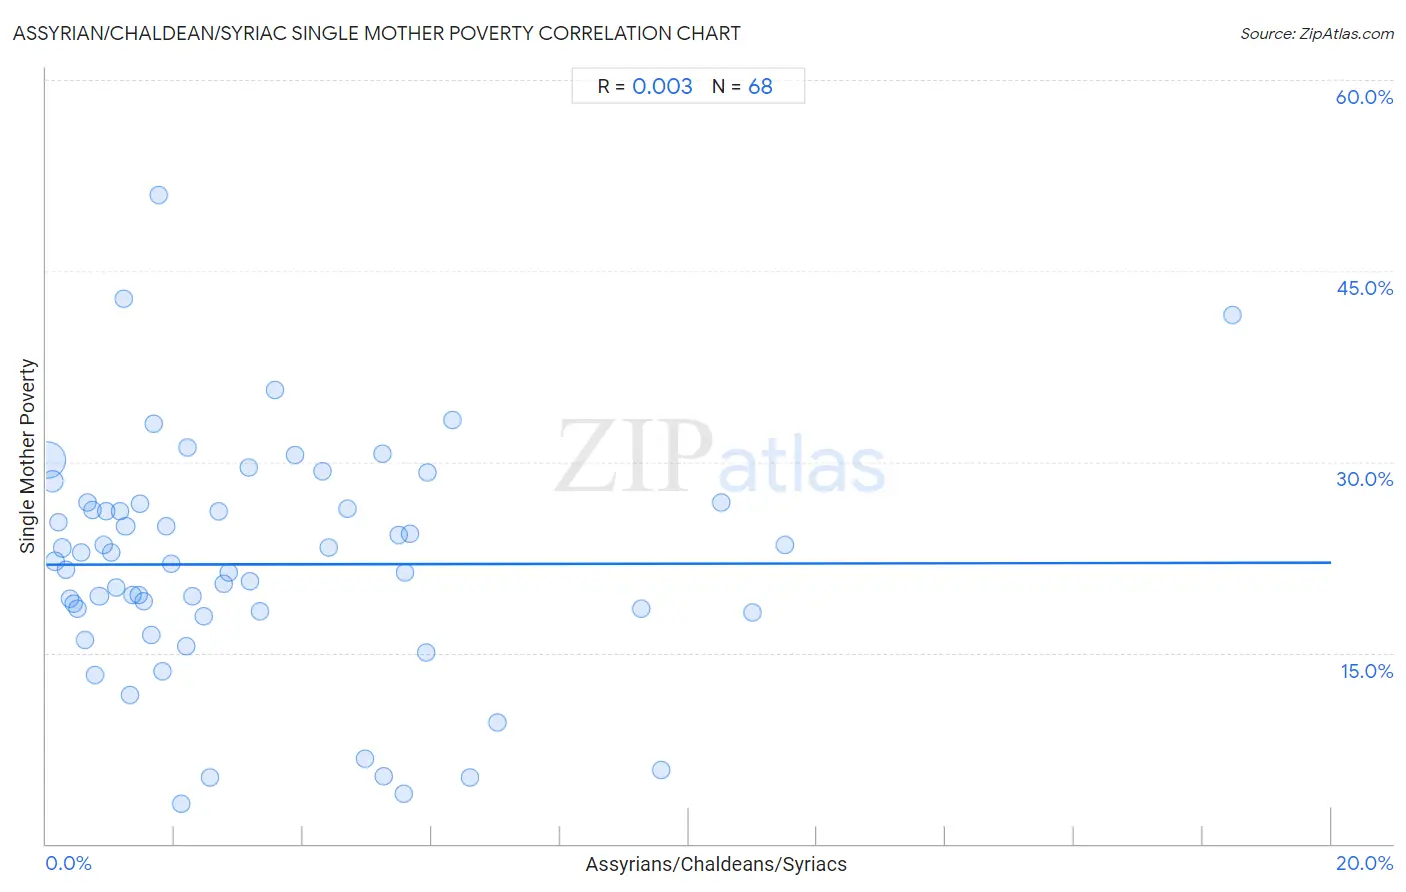
Assyrian/Chaldean/Syriac Single Mother Poverty Correlation Chart
The statistical analysis conducted on geographies consisting of 109,112,991 people shows no correlation between the proportion of Assyrians/Chaldeans/Syriacs and poverty level among single mothers in the United States with a correlation coefficient (R) of 0.003 and weighted average of 23.8%. On average, for every 1% (one percent) increase in Assyrians/Chaldeans/Syriacs within a typical geography, there is an increase of 0.0081% in poverty level among single mothers.
It is essential to understand that the correlation between the percentage of Assyrians/Chaldeans/Syriacs and poverty level among single mothers does not imply a direct cause-and-effect relationship. It remains uncertain whether the presence of Assyrians/Chaldeans/Syriacs influences an upward or downward trend in the level of poverty level among single mothers within an area, or if Assyrians/Chaldeans/Syriacs simply ended up residing in those areas with higher or lower levels of poverty level among single mothers due to other factors.
Demographics Similar to Assyrians/Chaldeans/Syriacs by Single Mother Poverty
In terms of single mother poverty, the demographic groups most similar to Assyrians/Chaldeans/Syriacs are Immigrants from India (23.8%, a difference of 0.020%), Immigrants from Taiwan (23.9%, a difference of 0.21%), Filipino (24.3%, a difference of 2.1%), Immigrants from Hong Kong (24.4%, a difference of 2.4%), and Thai (24.5%, a difference of 2.9%).
| Demographics | Rating | Rank | Single Mother Poverty |
| Assyrians/Chaldeans/Syriacs | 100.0 /100 | #1 | Exceptional 23.8% |
| Immigrants from India | 100.0 /100 | #2 | Exceptional 23.8% |
| Immigrants from Taiwan | 100.0 /100 | #3 | Exceptional 23.9% |
| Filipinos | 100.0 /100 | #4 | Exceptional 24.3% |
| Immigrants from Hong Kong | 100.0 /100 | #5 | Exceptional 24.4% |
| Thais | 100.0 /100 | #6 | Exceptional 24.5% |
| Chinese | 100.0 /100 | #7 | Exceptional 24.6% |
| Immigrants from Iran | 100.0 /100 | #8 | Exceptional 25.1% |
| Immigrants from Lithuania | 100.0 /100 | #9 | Exceptional 25.2% |
| Immigrants from South Central Asia | 100.0 /100 | #10 | Exceptional 25.3% |
| Iranians | 100.0 /100 | #11 | Exceptional 25.5% |
| Bhutanese | 100.0 /100 | #12 | Exceptional 25.6% |
| Indians (Asian) | 100.0 /100 | #13 | Exceptional 25.8% |
| Immigrants from Singapore | 100.0 /100 | #14 | Exceptional 25.8% |
| Immigrants from Ireland | 100.0 /100 | #15 | Exceptional 25.8% |
Assyrian/Chaldean/Syriac Single Mother Poverty Correlation Summary
| Measurement | Assyrian/Chaldean/Syriac Data | Single Mother Poverty Data |
| Minimum | 0.017% | 3.1% |
| Maximum | 18.5% | 50.9% |
| Range | 18.5% | 47.8% |
| Mean | 3.3% | 22.0% |
| Median | 2.1% | 22.1% |
| Interquartile 25% (IQ1) | 0.97% | 18.2% |
| Interquartile 75% (IQ3) | 5.1% | 26.5% |
| Interquartile Range (IQR) | 4.1% | 8.3% |
| Standard Deviation (Sample) | 3.4% | 9.1% |
| Standard Deviation (Population) | 3.4% | 9.0% |
Correlation Details
| Assyrian/Chaldean/Syriac Percentile | Sample Size | Single Mother Poverty |
[ 0.0% - 0.5% ] 0.017% | 76,289,192 | 30.2% |
[ 0.0% - 0.5% ] 0.088% | 15,544,508 | 28.5% |
[ 0.0% - 0.5% ] 0.14% | 4,826,829 | 22.2% |
[ 0.0% - 0.5% ] 0.19% | 2,584,821 | 25.3% |
[ 0.0% - 0.5% ] 0.25% | 1,518,415 | 23.2% |
[ 0.0% - 0.5% ] 0.31% | 2,217,663 | 21.5% |
[ 0.0% - 0.5% ] 0.38% | 371,311 | 19.2% |
[ 0.0% - 0.5% ] 0.43% | 700,463 | 18.9% |
[ 0.0% - 0.5% ] 0.49% | 382,392 | 18.5% |
[ 0.5% - 1.0% ] 0.54% | 346,239 | 22.9% |
[ 0.5% - 1.0% ] 0.61% | 218,718 | 16.0% |
[ 0.5% - 1.0% ] 0.65% | 153,305 | 26.8% |
[ 0.5% - 1.0% ] 0.71% | 158,089 | 26.2% |
[ 0.5% - 1.0% ] 0.76% | 100,899 | 13.2% |
[ 0.5% - 1.0% ] 0.83% | 252,842 | 19.5% |
[ 0.5% - 1.0% ] 0.89% | 419,987 | 23.5% |
[ 0.5% - 1.0% ] 0.94% | 351,049 | 26.1% |
[ 1.0% - 1.5% ] 1.01% | 121,482 | 22.9% |
[ 1.0% - 1.5% ] 1.09% | 67,503 | 20.1% |
[ 1.0% - 1.5% ] 1.14% | 55,734 | 26.1% |
[ 1.0% - 1.5% ] 1.20% | 24,044 | 42.8% |
[ 1.0% - 1.5% ] 1.24% | 112,930 | 24.9% |
[ 1.0% - 1.5% ] 1.31% | 65,237 | 11.7% |
[ 1.0% - 1.5% ] 1.34% | 138,765 | 19.5% |
[ 1.0% - 1.5% ] 1.43% | 43,921 | 19.6% |
[ 1.0% - 1.5% ] 1.45% | 79,187 | 26.7% |
[ 1.5% - 2.0% ] 1.51% | 88,230 | 19.1% |
[ 1.5% - 2.0% ] 1.64% | 53,590 | 16.4% |
[ 1.5% - 2.0% ] 1.68% | 105,302 | 33.0% |
[ 1.5% - 2.0% ] 1.75% | 25,759 | 50.9% |
[ 1.5% - 2.0% ] 1.81% | 5,195 | 13.6% |
[ 1.5% - 2.0% ] 1.86% | 190,578 | 24.9% |
[ 1.5% - 2.0% ] 1.94% | 37,785 | 22.0% |
[ 2.0% - 2.5% ] 2.10% | 27,827 | 3.1% |
[ 2.0% - 2.5% ] 2.18% | 83,562 | 15.5% |
[ 2.0% - 2.5% ] 2.19% | 6,248 | 31.1% |
[ 2.0% - 2.5% ] 2.28% | 33,033 | 19.5% |
[ 2.0% - 2.5% ] 2.46% | 57,042 | 17.8% |
[ 2.5% - 3.0% ] 2.55% | 61,494 | 5.2% |
[ 2.5% - 3.0% ] 2.68% | 78,068 | 26.1% |
[ 2.5% - 3.0% ] 2.76% | 38,003 | 20.4% |
[ 2.5% - 3.0% ] 2.85% | 3,864 | 21.3% |
[ 3.0% - 3.5% ] 3.16% | 19,083 | 29.5% |
[ 3.0% - 3.5% ] 3.17% | 14,403 | 20.7% |
[ 3.0% - 3.5% ] 3.32% | 59,225 | 18.3% |
[ 3.5% - 4.0% ] 3.55% | 23,765 | 35.7% |
[ 3.5% - 4.0% ] 3.87% | 45,266 | 30.6% |
[ 4.0% - 4.5% ] 4.29% | 128,151 | 29.3% |
[ 4.0% - 4.5% ] 4.40% | 96,358 | 23.3% |
[ 4.5% - 5.0% ] 4.69% | 59,775 | 26.3% |
[ 4.5% - 5.0% ] 4.96% | 26,536 | 6.7% |
[ 5.0% - 5.5% ] 5.23% | 45,937 | 30.6% |
[ 5.0% - 5.5% ] 5.25% | 27,848 | 5.3% |
[ 5.0% - 5.5% ] 5.48% | 67,076 | 24.3% |
[ 5.5% - 6.0% ] 5.56% | 34,004 | 4.0% |
[ 5.5% - 6.0% ] 5.58% | 9,320 | 21.3% |
[ 5.5% - 6.0% ] 5.66% | 29,330 | 24.3% |
[ 5.5% - 6.0% ] 5.91% | 22,152 | 15.0% |
[ 5.5% - 6.0% ] 5.94% | 33,170 | 29.2% |
[ 6.0% - 6.5% ] 6.32% | 2,342 | 33.3% |
[ 6.5% - 7.0% ] 6.60% | 16,742 | 5.2% |
[ 7.0% - 7.5% ] 7.02% | 38,727 | 9.6% |
[ 9.0% - 9.5% ] 9.27% | 34,921 | 18.4% |
[ 9.5% - 10.0% ] 9.58% | 33,174 | 5.8% |
[ 10.5% - 11.0% ] 10.51% | 21,587 | 26.8% |
[ 11.0% - 11.5% ] 11.00% | 6,018 | 18.2% |
[ 11.0% - 11.5% ] 11.50% | 133,744 | 23.5% |
[ 18.0% - 18.5% ] 18.47% | 43,232 | 41.5% |