Assyrian/Chaldean/Syriac No Schooling Completed
COMPARE
Assyrian/Chaldean/Syriac
Select to Compare
No Schooling Completed
Assyrian/Chaldean/Syriac No Schooling Completed
2.5%
NO SCHOOLING
0.6/ 100
METRIC RATING
258th/ 347
METRIC RANK
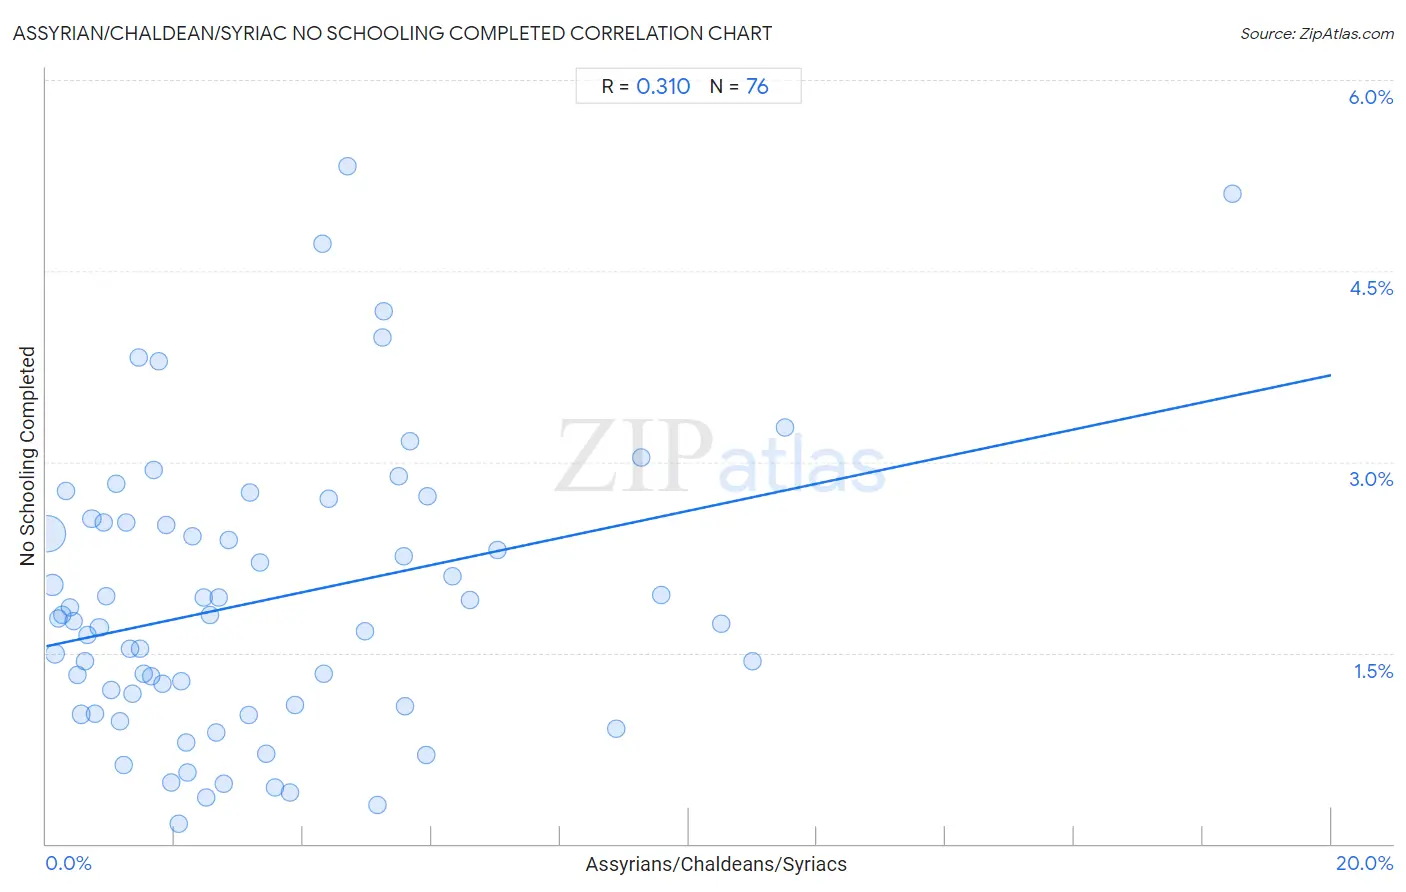
Assyrian/Chaldean/Syriac No Schooling Completed Correlation Chart
The statistical analysis conducted on geographies consisting of 110,066,308 people shows a mild positive correlation between the proportion of Assyrians/Chaldeans/Syriacs and percentage of population with no schooling in the United States with a correlation coefficient (R) of 0.310 and weighted average of 2.5%. On average, for every 1% (one percent) increase in Assyrians/Chaldeans/Syriacs within a typical geography, there is an increase of 0.11% in percentage of population with no schooling.
It is essential to understand that the correlation between the percentage of Assyrians/Chaldeans/Syriacs and percentage of population with no schooling does not imply a direct cause-and-effect relationship. It remains uncertain whether the presence of Assyrians/Chaldeans/Syriacs influences an upward or downward trend in the level of percentage of population with no schooling within an area, or if Assyrians/Chaldeans/Syriacs simply ended up residing in those areas with higher or lower levels of percentage of population with no schooling due to other factors.
Demographics Similar to Assyrians/Chaldeans/Syriacs by No Schooling Completed
In terms of no schooling completed, the demographic groups most similar to Assyrians/Chaldeans/Syriacs are Immigrants from South America (2.5%, a difference of 0.030%), Immigrants from Jamaica (2.5%, a difference of 0.060%), Immigrants from Ethiopia (2.5%, a difference of 0.11%), Armenian (2.5%, a difference of 0.23%), and Immigrants from Sierra Leone (2.5%, a difference of 0.58%).
| Demographics | Rating | Rank | No Schooling Completed |
| Immigrants from Africa | 1.1 /100 | #251 | Tragic 2.4% |
| Immigrants from Colombia | 1.0 /100 | #252 | Tragic 2.4% |
| Immigrants from Asia | 0.9 /100 | #253 | Tragic 2.4% |
| Immigrants from Eastern Africa | 0.9 /100 | #254 | Tragic 2.4% |
| Ethiopians | 0.8 /100 | #255 | Tragic 2.4% |
| Yaqui | 0.8 /100 | #256 | Tragic 2.4% |
| Immigrants from South America | 0.6 /100 | #257 | Tragic 2.5% |
| Assyrians/Chaldeans/Syriacs | 0.6 /100 | #258 | Tragic 2.5% |
| Immigrants from Jamaica | 0.6 /100 | #259 | Tragic 2.5% |
| Immigrants from Ethiopia | 0.6 /100 | #260 | Tragic 2.5% |
| Armenians | 0.5 /100 | #261 | Tragic 2.5% |
| Immigrants from Sierra Leone | 0.5 /100 | #262 | Tragic 2.5% |
| Immigrants from Liberia | 0.4 /100 | #263 | Tragic 2.5% |
| Indians (Asian) | 0.4 /100 | #264 | Tragic 2.5% |
| West Indians | 0.4 /100 | #265 | Tragic 2.5% |
Assyrian/Chaldean/Syriac No Schooling Completed Correlation Summary
| Measurement | Assyrian/Chaldean/Syriac Data | No Schooling Completed Data |
| Minimum | 0.017% | 0.15% |
| Maximum | 18.5% | 5.3% |
| Range | 18.5% | 5.2% |
| Mean | 3.4% | 1.9% |
| Median | 2.4% | 1.8% |
| Interquartile 25% (IQ1) | 1.1% | 1.1% |
| Interquartile 75% (IQ3) | 5.1% | 2.5% |
| Interquartile Range (IQR) | 3.9% | 1.4% |
| Standard Deviation (Sample) | 3.3% | 1.1% |
| Standard Deviation (Population) | 3.3% | 1.1% |
Correlation Details
| Assyrian/Chaldean/Syriac Percentile | Sample Size | No Schooling Completed |
[ 0.0% - 0.5% ] 0.017% | 76,584,670 | 2.4% |
[ 0.0% - 0.5% ] 0.088% | 15,696,208 | 2.0% |
[ 0.0% - 0.5% ] 0.14% | 4,964,679 | 1.5% |
[ 0.0% - 0.5% ] 0.19% | 2,644,241 | 1.8% |
[ 0.0% - 0.5% ] 0.25% | 1,561,797 | 1.8% |
[ 0.0% - 0.5% ] 0.31% | 2,267,515 | 2.8% |
[ 0.0% - 0.5% ] 0.38% | 405,485 | 1.9% |
[ 0.0% - 0.5% ] 0.43% | 729,415 | 1.8% |
[ 0.0% - 0.5% ] 0.49% | 399,975 | 1.3% |
[ 0.5% - 1.0% ] 0.54% | 367,959 | 1.0% |
[ 0.5% - 1.0% ] 0.61% | 221,205 | 1.4% |
[ 0.5% - 1.0% ] 0.65% | 147,663 | 1.6% |
[ 0.5% - 1.0% ] 0.71% | 161,276 | 2.5% |
[ 0.5% - 1.0% ] 0.76% | 92,151 | 1.0% |
[ 0.5% - 1.0% ] 0.83% | 254,310 | 1.7% |
[ 0.5% - 1.0% ] 0.89% | 441,206 | 2.5% |
[ 0.5% - 1.0% ] 0.94% | 355,589 | 1.9% |
[ 1.0% - 1.5% ] 1.01% | 121,482 | 1.2% |
[ 1.0% - 1.5% ] 1.09% | 67,216 | 2.8% |
[ 1.0% - 1.5% ] 1.14% | 55,734 | 0.97% |
[ 1.0% - 1.5% ] 1.20% | 24,044 | 0.62% |
[ 1.0% - 1.5% ] 1.24% | 117,116 | 2.5% |
[ 1.0% - 1.5% ] 1.31% | 65,237 | 1.5% |
[ 1.0% - 1.5% ] 1.35% | 148,615 | 1.2% |
[ 1.0% - 1.5% ] 1.43% | 42,621 | 3.8% |
[ 1.0% - 1.5% ] 1.45% | 79,187 | 1.5% |
[ 1.5% - 2.0% ] 1.52% | 106,355 | 1.3% |
[ 1.5% - 2.0% ] 1.64% | 53,590 | 1.3% |
[ 1.5% - 2.0% ] 1.68% | 105,302 | 2.9% |
[ 1.5% - 2.0% ] 1.75% | 24,626 | 3.8% |
[ 1.5% - 2.0% ] 1.82% | 16,823 | 1.3% |
[ 1.5% - 2.0% ] 1.87% | 197,840 | 2.5% |
[ 1.5% - 2.0% ] 1.94% | 37,785 | 0.48% |
[ 2.0% - 2.5% ] 2.07% | 5,704 | 0.15% |
[ 2.0% - 2.5% ] 2.10% | 27,827 | 1.3% |
[ 2.0% - 2.5% ] 2.18% | 83,562 | 0.79% |
[ 2.0% - 2.5% ] 2.19% | 6,248 | 0.56% |
[ 2.0% - 2.5% ] 2.28% | 33,033 | 2.4% |
[ 2.0% - 2.5% ] 2.46% | 57,042 | 1.9% |
[ 2.0% - 2.5% ] 2.49% | 1,729 | 0.36% |
[ 2.5% - 3.0% ] 2.55% | 61,494 | 1.8% |
[ 2.5% - 3.0% ] 2.64% | 4,400 | 0.87% |
[ 2.5% - 3.0% ] 2.68% | 78,068 | 1.9% |
[ 2.5% - 3.0% ] 2.76% | 38,003 | 0.47% |
[ 2.5% - 3.0% ] 2.85% | 3,864 | 2.4% |
[ 3.0% - 3.5% ] 3.16% | 19,083 | 1.0% |
[ 3.0% - 3.5% ] 3.17% | 14,403 | 2.8% |
[ 3.0% - 3.5% ] 3.32% | 59,225 | 2.2% |
[ 3.0% - 3.5% ] 3.43% | 19,135 | 0.70% |
[ 3.5% - 4.0% ] 3.55% | 23,765 | 0.44% |
[ 3.5% - 4.0% ] 3.79% | 2,771 | 0.40% |
[ 3.5% - 4.0% ] 3.87% | 45,266 | 1.1% |
[ 4.0% - 4.5% ] 4.29% | 128,151 | 4.7% |
[ 4.0% - 4.5% ] 4.33% | 3,698 | 1.3% |
[ 4.0% - 4.5% ] 4.40% | 96,358 | 2.7% |
[ 4.5% - 5.0% ] 4.69% | 59,775 | 5.3% |
[ 4.5% - 5.0% ] 4.96% | 26,536 | 1.7% |
[ 5.0% - 5.5% ] 5.16% | 4,402 | 0.30% |
[ 5.0% - 5.5% ] 5.23% | 45,937 | 4.0% |
[ 5.0% - 5.5% ] 5.25% | 27,848 | 4.2% |
[ 5.0% - 5.5% ] 5.48% | 67,076 | 2.9% |
[ 5.5% - 6.0% ] 5.56% | 34,004 | 2.3% |
[ 5.5% - 6.0% ] 5.58% | 9,320 | 1.1% |
[ 5.5% - 6.0% ] 5.66% | 29,330 | 3.2% |
[ 5.5% - 6.0% ] 5.91% | 22,152 | 0.70% |
[ 5.5% - 6.0% ] 5.94% | 33,170 | 2.7% |
[ 6.0% - 6.5% ] 6.32% | 2,342 | 2.1% |
[ 6.5% - 7.0% ] 6.60% | 16,742 | 1.9% |
[ 7.0% - 7.5% ] 7.02% | 38,727 | 2.3% |
[ 8.5% - 9.0% ] 8.86% | 4,525 | 0.90% |
[ 9.0% - 9.5% ] 9.27% | 34,921 | 3.0% |
[ 9.5% - 10.0% ] 9.58% | 33,174 | 2.0% |
[ 10.5% - 11.0% ] 10.51% | 21,587 | 1.7% |
[ 11.0% - 11.5% ] 11.00% | 6,018 | 1.4% |
[ 11.0% - 11.5% ] 11.50% | 133,744 | 3.3% |
[ 18.0% - 18.5% ] 18.47% | 43,232 | 5.1% |