Assyrian/Chaldean/Syriac Unemployment Among Women with Children Ages 6 to 17 years
COMPARE
Assyrian/Chaldean/Syriac
Select to Compare
Unemployment Among Women with Children Ages 6 to 17 years
Assyrian/Chaldean/Syriac Unemployment Among Women with Children Ages 6 to 17 years
7.2%
UNEMPLOYMENT | WOMEN W/ CHILDREN 6 TO 17
100.0/ 100
METRIC RATING
9th/ 347
METRIC RANK
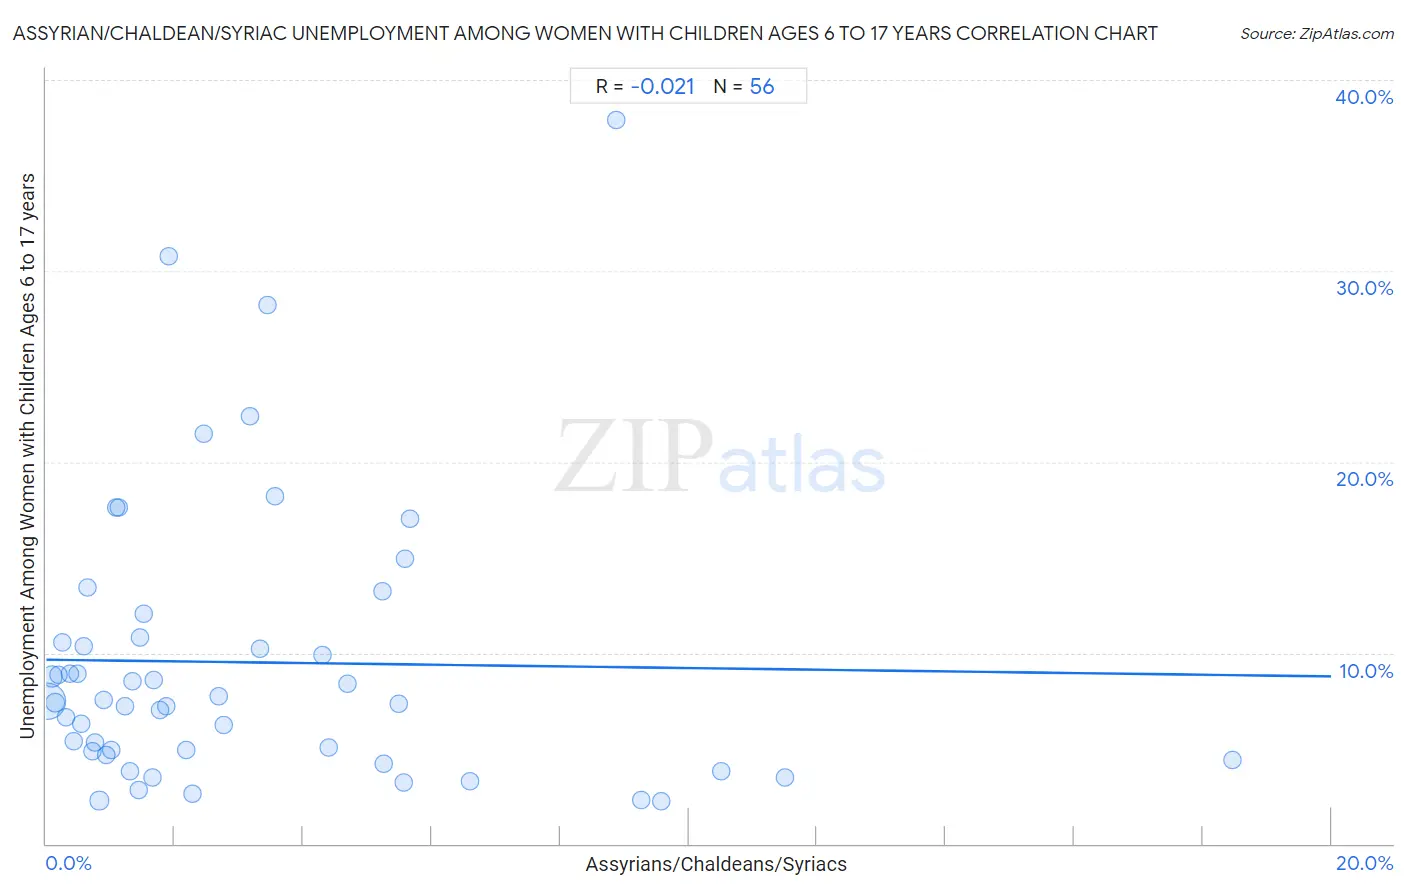
Assyrian/Chaldean/Syriac Unemployment Among Women with Children Ages 6 to 17 years Correlation Chart
The statistical analysis conducted on geographies consisting of 94,071,494 people shows no correlation between the proportion of Assyrians/Chaldeans/Syriacs and unemployment rate among women with children between the ages 6 and 17 in the United States with a correlation coefficient (R) of -0.021 and weighted average of 7.2%. On average, for every 1% (one percent) increase in Assyrians/Chaldeans/Syriacs within a typical geography, there is a decrease of 0.044% in unemployment rate among women with children between the ages 6 and 17.
It is essential to understand that the correlation between the percentage of Assyrians/Chaldeans/Syriacs and unemployment rate among women with children between the ages 6 and 17 does not imply a direct cause-and-effect relationship. It remains uncertain whether the presence of Assyrians/Chaldeans/Syriacs influences an upward or downward trend in the level of unemployment rate among women with children between the ages 6 and 17 within an area, or if Assyrians/Chaldeans/Syriacs simply ended up residing in those areas with higher or lower levels of unemployment rate among women with children between the ages 6 and 17 due to other factors.
Demographics Similar to Assyrians/Chaldeans/Syriacs by Unemployment Among Women with Children Ages 6 to 17 years
In terms of unemployment among women with children ages 6 to 17 years, the demographic groups most similar to Assyrians/Chaldeans/Syriacs are Immigrants from Hong Kong (7.2%, a difference of 0.31%), Immigrants from Fiji (7.3%, a difference of 0.97%), Immigrants from Taiwan (7.3%, a difference of 1.7%), Soviet Union (7.1%, a difference of 1.7%), and Tlingit-Haida (7.1%, a difference of 1.8%).
| Demographics | Rating | Rank | Unemployment Among Women with Children Ages 6 to 17 years |
| Fijians | 100.0 /100 | #2 | Exceptional 6.6% |
| Tongans | 100.0 /100 | #3 | Exceptional 6.7% |
| Ute | 100.0 /100 | #4 | Exceptional 7.0% |
| Okinawans | 100.0 /100 | #5 | Exceptional 7.0% |
| Tlingit-Haida | 100.0 /100 | #6 | Exceptional 7.1% |
| Soviet Union | 100.0 /100 | #7 | Exceptional 7.1% |
| Immigrants from Hong Kong | 100.0 /100 | #8 | Exceptional 7.2% |
| Assyrians/Chaldeans/Syriacs | 100.0 /100 | #9 | Exceptional 7.2% |
| Immigrants from Fiji | 100.0 /100 | #10 | Exceptional 7.3% |
| Immigrants from Taiwan | 100.0 /100 | #11 | Exceptional 7.3% |
| Bangladeshis | 100.0 /100 | #12 | Exceptional 7.4% |
| Indonesians | 100.0 /100 | #13 | Exceptional 7.4% |
| Sudanese | 100.0 /100 | #14 | Exceptional 7.4% |
| Puget Sound Salish | 100.0 /100 | #15 | Exceptional 7.5% |
| Immigrants from Burma/Myanmar | 100.0 /100 | #16 | Exceptional 7.5% |
Assyrian/Chaldean/Syriac Unemployment Among Women with Children Ages 6 to 17 years Correlation Summary
| Measurement | Assyrian/Chaldean/Syriac Data | Unemployment Among Women with Children Ages 6 to 17 years Data |
| Minimum | 0.016% | 2.2% |
| Maximum | 18.5% | 37.9% |
| Range | 18.5% | 35.7% |
| Mean | 3.1% | 9.5% |
| Median | 1.7% | 7.4% |
| Interquartile 25% (IQ1) | 0.79% | 4.7% |
| Interquartile 75% (IQ3) | 4.5% | 10.7% |
| Interquartile Range (IQR) | 3.7% | 5.9% |
| Standard Deviation (Sample) | 3.5% | 7.4% |
| Standard Deviation (Population) | 3.5% | 7.3% |
Correlation Details
| Assyrian/Chaldean/Syriac Percentile | Sample Size | Unemployment Among Women with Children Ages 6 to 17 years |
[ 0.0% - 0.5% ] 0.016% | 69,715,412 | 7.5% |
[ 0.0% - 0.5% ] 0.090% | 12,244,239 | 8.8% |
[ 0.0% - 0.5% ] 0.14% | 3,407,369 | 7.4% |
[ 0.0% - 0.5% ] 0.19% | 1,697,003 | 8.8% |
[ 0.0% - 0.5% ] 0.25% | 971,971 | 10.6% |
[ 0.0% - 0.5% ] 0.31% | 1,853,933 | 6.6% |
[ 0.0% - 0.5% ] 0.37% | 332,552 | 8.9% |
[ 0.0% - 0.5% ] 0.44% | 375,944 | 5.4% |
[ 0.0% - 0.5% ] 0.48% | 203,400 | 8.9% |
[ 0.5% - 1.0% ] 0.55% | 110,540 | 6.3% |
[ 0.5% - 1.0% ] 0.59% | 57,536 | 10.3% |
[ 0.5% - 1.0% ] 0.65% | 145,987 | 13.4% |
[ 0.5% - 1.0% ] 0.71% | 99,099 | 4.9% |
[ 0.5% - 1.0% ] 0.76% | 92,151 | 5.3% |
[ 0.5% - 1.0% ] 0.83% | 243,562 | 2.3% |
[ 0.5% - 1.0% ] 0.89% | 415,762 | 7.5% |
[ 0.5% - 1.0% ] 0.94% | 111,847 | 4.6% |
[ 1.0% - 1.5% ] 1.01% | 100,820 | 4.9% |
[ 1.0% - 1.5% ] 1.09% | 5,228 | 17.6% |
[ 1.0% - 1.5% ] 1.13% | 5,059 | 17.6% |
[ 1.0% - 1.5% ] 1.23% | 84,167 | 7.2% |
[ 1.0% - 1.5% ] 1.30% | 33,910 | 3.8% |
[ 1.0% - 1.5% ] 1.35% | 62,724 | 8.5% |
[ 1.0% - 1.5% ] 1.43% | 42,621 | 2.8% |
[ 1.0% - 1.5% ] 1.45% | 79,187 | 10.8% |
[ 1.5% - 2.0% ] 1.52% | 81,914 | 12.0% |
[ 1.5% - 2.0% ] 1.65% | 24,254 | 3.5% |
[ 1.5% - 2.0% ] 1.68% | 105,302 | 8.6% |
[ 1.5% - 2.0% ] 1.76% | 10,896 | 7.0% |
[ 1.5% - 2.0% ] 1.87% | 162,315 | 7.2% |
[ 1.5% - 2.0% ] 1.91% | 7,159 | 30.8% |
[ 2.0% - 2.5% ] 2.18% | 83,562 | 4.9% |
[ 2.0% - 2.5% ] 2.28% | 33,033 | 2.6% |
[ 2.0% - 2.5% ] 2.46% | 57,042 | 21.5% |
[ 2.5% - 3.0% ] 2.68% | 78,068 | 7.8% |
[ 2.5% - 3.0% ] 2.76% | 38,003 | 6.2% |
[ 3.0% - 3.5% ] 3.17% | 14,403 | 22.4% |
[ 3.0% - 3.5% ] 3.32% | 59,225 | 10.2% |
[ 3.0% - 3.5% ] 3.44% | 14,806 | 28.2% |
[ 3.5% - 4.0% ] 3.55% | 23,765 | 18.2% |
[ 4.0% - 4.5% ] 4.29% | 128,151 | 9.9% |
[ 4.0% - 4.5% ] 4.40% | 96,358 | 5.0% |
[ 4.5% - 5.0% ] 4.69% | 59,775 | 8.4% |
[ 5.0% - 5.5% ] 5.23% | 45,937 | 13.2% |
[ 5.0% - 5.5% ] 5.25% | 27,848 | 4.2% |
[ 5.0% - 5.5% ] 5.48% | 67,076 | 7.3% |
[ 5.5% - 6.0% ] 5.56% | 34,004 | 3.2% |
[ 5.5% - 6.0% ] 5.58% | 9,320 | 14.9% |
[ 5.5% - 6.0% ] 5.66% | 29,330 | 17.0% |
[ 6.5% - 7.0% ] 6.60% | 16,742 | 3.3% |
[ 8.5% - 9.0% ] 8.86% | 4,525 | 37.9% |
[ 9.0% - 9.5% ] 9.27% | 34,921 | 2.3% |
[ 9.5% - 10.0% ] 9.58% | 33,174 | 2.2% |
[ 10.5% - 11.0% ] 10.51% | 21,587 | 3.8% |
[ 11.0% - 11.5% ] 11.50% | 133,744 | 3.5% |
[ 18.0% - 18.5% ] 18.47% | 43,232 | 4.4% |