Assyrian/Chaldean/Syriac Unemployment Among Women with Children Under 6 years
COMPARE
Assyrian/Chaldean/Syriac
Select to Compare
Unemployment Among Women with Children Under 6 years
Assyrian/Chaldean/Syriac Unemployment Among Women with Children Under 6 years
6.5%
UNEMPLOYMENT | WOMEN W/ CHILDREN < 6
100.0/ 100
METRIC RATING
18th/ 347
METRIC RANK
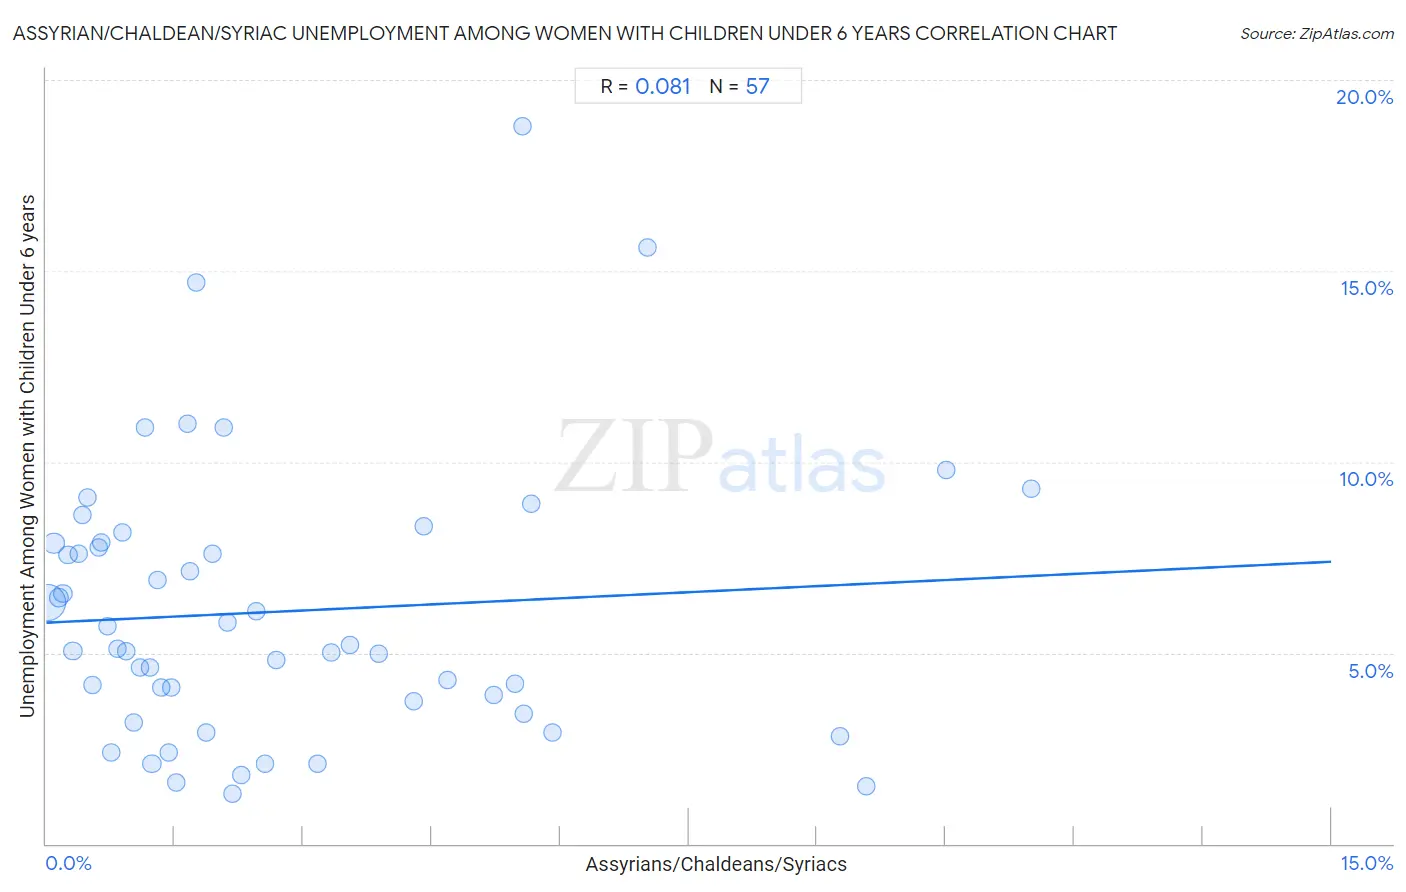
Assyrian/Chaldean/Syriac Unemployment Among Women with Children Under 6 years Correlation Chart
The statistical analysis conducted on geographies consisting of 98,335,487 people shows a slight positive correlation between the proportion of Assyrians/Chaldeans/Syriacs and unemployment rate among women with children under the age of 6 in the United States with a correlation coefficient (R) of 0.081 and weighted average of 6.5%. On average, for every 1% (one percent) increase in Assyrians/Chaldeans/Syriacs within a typical geography, there is an increase of 0.11% in unemployment rate among women with children under the age of 6.
It is essential to understand that the correlation between the percentage of Assyrians/Chaldeans/Syriacs and unemployment rate among women with children under the age of 6 does not imply a direct cause-and-effect relationship. It remains uncertain whether the presence of Assyrians/Chaldeans/Syriacs influences an upward or downward trend in the level of unemployment rate among women with children under the age of 6 within an area, or if Assyrians/Chaldeans/Syriacs simply ended up residing in those areas with higher or lower levels of unemployment rate among women with children under the age of 6 due to other factors.
Demographics Similar to Assyrians/Chaldeans/Syriacs by Unemployment Among Women with Children Under 6 years
In terms of unemployment among women with children under 6 years, the demographic groups most similar to Assyrians/Chaldeans/Syriacs are Mongolian (6.5%, a difference of 0.32%), Ute (6.5%, a difference of 0.38%), Burmese (6.5%, a difference of 0.43%), Immigrants from Korea (6.5%, a difference of 0.85%), and Immigrants from Malaysia (6.4%, a difference of 0.98%).
| Demographics | Rating | Rank | Unemployment Among Women with Children Under 6 years |
| Indians (Asian) | 100.0 /100 | #11 | Exceptional 6.3% |
| Immigrants from Singapore | 100.0 /100 | #12 | Exceptional 6.3% |
| Immigrants from Eastern Asia | 100.0 /100 | #13 | Exceptional 6.3% |
| Immigrants from Bulgaria | 100.0 /100 | #14 | Exceptional 6.3% |
| Thais | 100.0 /100 | #15 | Exceptional 6.3% |
| Immigrants from Uzbekistan | 100.0 /100 | #16 | Exceptional 6.3% |
| Immigrants from Malaysia | 100.0 /100 | #17 | Exceptional 6.4% |
| Assyrians/Chaldeans/Syriacs | 100.0 /100 | #18 | Exceptional 6.5% |
| Mongolians | 100.0 /100 | #19 | Exceptional 6.5% |
| Ute | 100.0 /100 | #20 | Exceptional 6.5% |
| Burmese | 100.0 /100 | #21 | Exceptional 6.5% |
| Immigrants from Korea | 100.0 /100 | #22 | Exceptional 6.5% |
| Bulgarians | 100.0 /100 | #23 | Exceptional 6.5% |
| Laotians | 100.0 /100 | #24 | Exceptional 6.5% |
| Soviet Union | 100.0 /100 | #25 | Exceptional 6.5% |
Assyrian/Chaldean/Syriac Unemployment Among Women with Children Under 6 years Correlation Summary
| Measurement | Assyrian/Chaldean/Syriac Data | Unemployment Among Women with Children Under 6 years Data |
| Minimum | 0.016% | 1.3% |
| Maximum | 11.5% | 18.8% |
| Range | 11.5% | 17.5% |
| Mean | 2.7% | 6.1% |
| Median | 1.7% | 5.1% |
| Interquartile 25% (IQ1) | 0.79% | 3.6% |
| Interquartile 75% (IQ3) | 4.1% | 7.9% |
| Interquartile Range (IQR) | 3.3% | 4.3% |
| Standard Deviation (Sample) | 2.7% | 3.6% |
| Standard Deviation (Population) | 2.7% | 3.5% |
Correlation Details
| Assyrian/Chaldean/Syriac Percentile | Sample Size | Unemployment Among Women with Children Under 6 years |
[ 0.0% - 0.5% ] 0.016% | 71,590,274 | 6.3% |
[ 0.0% - 0.5% ] 0.089% | 13,344,804 | 7.9% |
[ 0.0% - 0.5% ] 0.14% | 3,835,696 | 6.5% |
[ 0.0% - 0.5% ] 0.19% | 1,925,504 | 6.5% |
[ 0.0% - 0.5% ] 0.25% | 969,465 | 7.6% |
[ 0.0% - 0.5% ] 0.31% | 1,948,486 | 5.0% |
[ 0.0% - 0.5% ] 0.38% | 271,980 | 7.6% |
[ 0.0% - 0.5% ] 0.43% | 516,653 | 8.6% |
[ 0.0% - 0.5% ] 0.49% | 268,385 | 9.1% |
[ 0.5% - 1.0% ] 0.54% | 190,977 | 4.1% |
[ 0.5% - 1.0% ] 0.61% | 183,146 | 7.8% |
[ 0.5% - 1.0% ] 0.65% | 145,987 | 7.9% |
[ 0.5% - 1.0% ] 0.71% | 68,681 | 5.7% |
[ 0.5% - 1.0% ] 0.76% | 92,151 | 2.4% |
[ 0.5% - 1.0% ] 0.83% | 216,983 | 5.1% |
[ 0.5% - 1.0% ] 0.89% | 412,386 | 8.1% |
[ 0.5% - 1.0% ] 0.94% | 209,873 | 5.0% |
[ 1.0% - 1.5% ] 1.02% | 68,627 | 3.2% |
[ 1.0% - 1.5% ] 1.09% | 61,988 | 4.6% |
[ 1.0% - 1.5% ] 1.15% | 30,130 | 10.9% |
[ 1.0% - 1.5% ] 1.21% | 20,878 | 4.6% |
[ 1.0% - 1.5% ] 1.23% | 87,759 | 2.1% |
[ 1.0% - 1.5% ] 1.30% | 42,391 | 6.9% |
[ 1.0% - 1.5% ] 1.34% | 123,405 | 4.1% |
[ 1.0% - 1.5% ] 1.43% | 42,621 | 2.4% |
[ 1.0% - 1.5% ] 1.45% | 79,187 | 4.1% |
[ 1.5% - 2.0% ] 1.52% | 106,355 | 1.6% |
[ 1.5% - 2.0% ] 1.65% | 24,254 | 11.0% |
[ 1.5% - 2.0% ] 1.67% | 86,488 | 7.2% |
[ 1.5% - 2.0% ] 1.75% | 21,902 | 14.7% |
[ 1.5% - 2.0% ] 1.87% | 138,588 | 2.9% |
[ 1.5% - 2.0% ] 1.94% | 30,626 | 7.6% |
[ 2.0% - 2.5% ] 2.07% | 5,704 | 10.9% |
[ 2.0% - 2.5% ] 2.12% | 10,461 | 5.8% |
[ 2.0% - 2.5% ] 2.18% | 83,562 | 1.3% |
[ 2.0% - 2.5% ] 2.28% | 33,033 | 1.8% |
[ 2.0% - 2.5% ] 2.46% | 57,042 | 6.1% |
[ 2.5% - 3.0% ] 2.55% | 61,494 | 2.1% |
[ 2.5% - 3.0% ] 2.68% | 49,820 | 4.8% |
[ 3.0% - 3.5% ] 3.16% | 19,083 | 2.1% |
[ 3.0% - 3.5% ] 3.32% | 59,225 | 5.0% |
[ 3.5% - 4.0% ] 3.55% | 23,765 | 5.2% |
[ 3.5% - 4.0% ] 3.87% | 45,266 | 5.0% |
[ 4.0% - 4.5% ] 4.29% | 128,151 | 3.7% |
[ 4.0% - 4.5% ] 4.40% | 72,504 | 8.3% |
[ 4.5% - 5.0% ] 4.69% | 59,775 | 4.3% |
[ 5.0% - 5.5% ] 5.23% | 45,937 | 3.9% |
[ 5.0% - 5.5% ] 5.48% | 67,076 | 4.2% |
[ 5.5% - 6.0% ] 5.56% | 34,004 | 18.8% |
[ 5.5% - 6.0% ] 5.58% | 9,320 | 3.4% |
[ 5.5% - 6.0% ] 5.66% | 29,330 | 8.9% |
[ 5.5% - 6.0% ] 5.91% | 22,152 | 2.9% |
[ 7.0% - 7.5% ] 7.02% | 38,727 | 15.6% |
[ 9.0% - 9.5% ] 9.27% | 34,921 | 2.8% |
[ 9.5% - 10.0% ] 9.58% | 33,174 | 1.5% |
[ 10.5% - 11.0% ] 10.51% | 21,587 | 9.8% |
[ 11.0% - 11.5% ] 11.50% | 133,744 | 9.3% |