Yup'ik Unemployment Among Women with Children Ages 6 to 17 years
COMPARE
Yup'ik
Select to Compare
Unemployment Among Women with Children Ages 6 to 17 years
Yup'ik Unemployment Among Women with Children Ages 6 to 17 years
18.6%
UNEMPLOYMENT | WOMEN W/ CHILDREN 6 TO 17
0.0/ 100
METRIC RATING
346th/ 347
METRIC RANK
Yup'ik Unemployment Among Women with Children Ages 6 to 17 years Correlation Chart
The statistical analysis conducted on geographies consisting of 36,613,945 people shows a substantial positive correlation between the proportion of Yup'ik and unemployment rate among women with children between the ages 6 and 17 in the United States with a correlation coefficient (R) of 0.563 and weighted average of 18.6%. On average, for every 1% (one percent) increase in Yup'ik within a typical geography, there is an increase of 0.31% in unemployment rate among women with children between the ages 6 and 17.
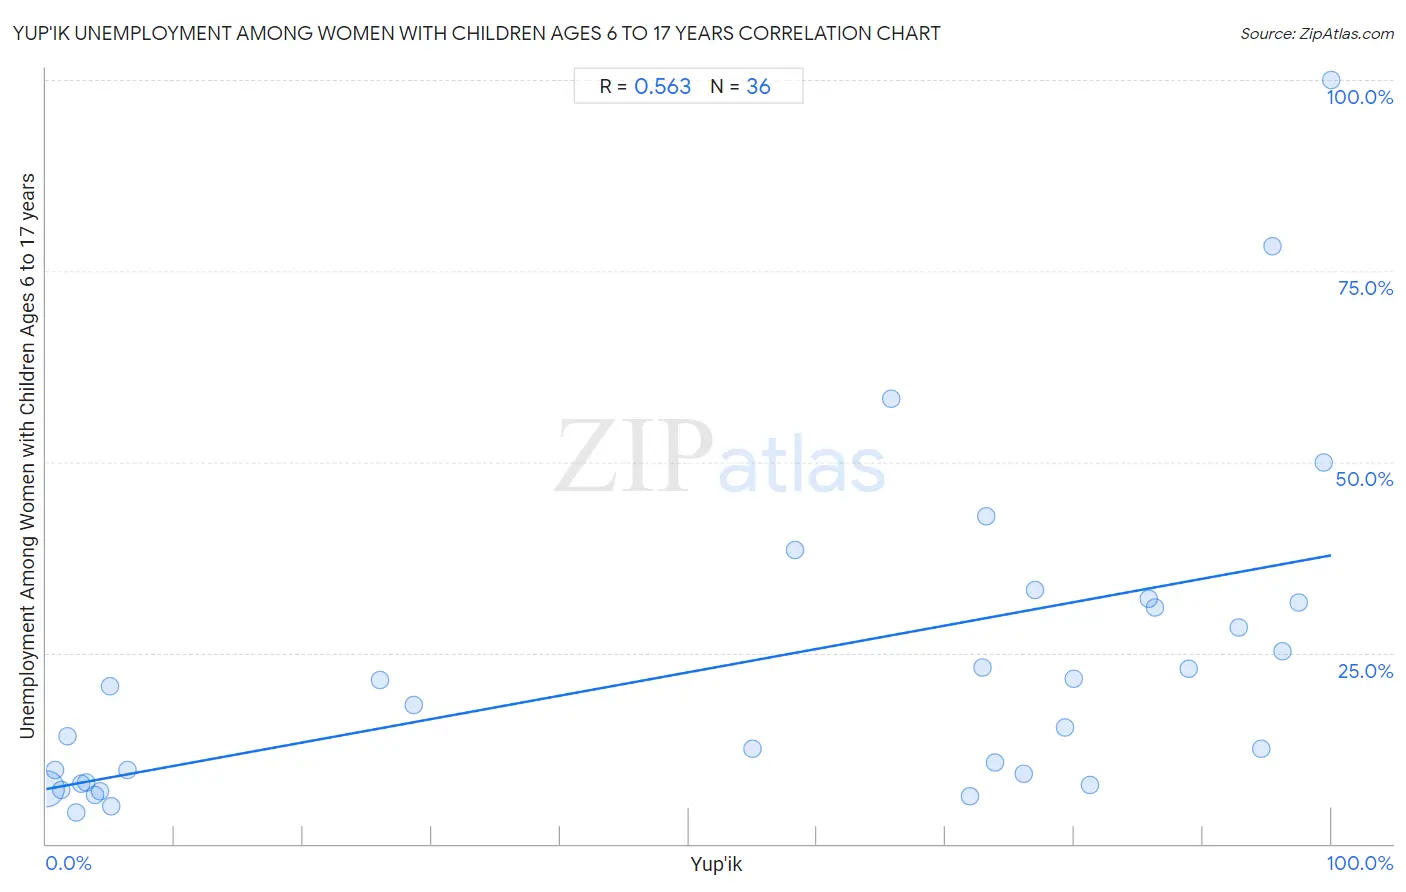
It is essential to understand that the correlation between the percentage of Yup'ik and unemployment rate among women with children between the ages 6 and 17 does not imply a direct cause-and-effect relationship. It remains uncertain whether the presence of Yup'ik influences an upward or downward trend in the level of unemployment rate among women with children between the ages 6 and 17 within an area, or if Yup'ik simply ended up residing in those areas with higher or lower levels of unemployment rate among women with children between the ages 6 and 17 due to other factors.
Demographics Similar to Yup'ik by Unemployment Among Women with Children Ages 6 to 17 years
In terms of unemployment among women with children ages 6 to 17 years, the demographic groups most similar to Yup'ik are Pima (18.9%, a difference of 1.4%), Arapaho (16.8%, a difference of 10.4%), Cheyenne (16.4%, a difference of 13.6%), Inupiat (14.9%, a difference of 25.3%), and Yuman (14.8%, a difference of 25.7%).
| Demographics | Rating | Rank | Unemployment Among Women with Children Ages 6 to 17 years |
| Natives/Alaskans | 0.0 /100 | #333 | Tragic 11.5% |
| Ugandans | 0.0 /100 | #334 | Tragic 12.0% |
| Colville | 0.0 /100 | #335 | Tragic 12.3% |
| Houma | 0.0 /100 | #336 | Tragic 12.5% |
| Immigrants from Yemen | 0.0 /100 | #337 | Tragic 12.7% |
| Hopi | 0.0 /100 | #338 | Tragic 12.9% |
| Sioux | 0.0 /100 | #339 | Tragic 13.2% |
| Puerto Ricans | 0.0 /100 | #340 | Tragic 13.9% |
| Navajo | 0.0 /100 | #341 | Tragic 14.2% |
| Yuman | 0.0 /100 | #342 | Tragic 14.8% |
| Inupiat | 0.0 /100 | #343 | Tragic 14.9% |
| Cheyenne | 0.0 /100 | #344 | Tragic 16.4% |
| Arapaho | 0.0 /100 | #345 | Tragic 16.8% |
| Yup'ik | 0.0 /100 | #346 | Tragic 18.6% |
| Pima | 0.0 /100 | #347 | Tragic 18.9% |
Yup'ik Unemployment Among Women with Children Ages 6 to 17 years Correlation Summary
| Measurement | Yup'ik Data | Unemployment Among Women with Children Ages 6 to 17 years Data |
| Minimum | 0.016% | 4.1% |
| Maximum | 100.0% | 100.0% |
| Range | 100.0% | 95.9% |
| Mean | 52.5% | 23.2% |
| Median | 72.4% | 16.7% |
| Interquartile 25% (IQ1) | 4.6% | 7.9% |
| Interquartile 75% (IQ3) | 86.1% | 31.3% |
| Interquartile Range (IQR) | 81.5% | 23.4% |
| Standard Deviation (Sample) | 39.0% | 21.2% |
| Standard Deviation (Population) | 38.5% | 20.9% |
Correlation Details
| Yup'ik Percentile | Sample Size | Unemployment Among Women with Children Ages 6 to 17 years |
[ 0.0% - 0.5% ] 0.016% | 35,804,389 | 7.1% |
[ 0.5% - 1.0% ] 0.64% | 107,507 | 9.6% |
[ 1.0% - 1.5% ] 1.17% | 81,255 | 7.1% |
[ 1.5% - 2.0% ] 1.63% | 67,867 | 14.0% |
[ 2.0% - 2.5% ] 2.32% | 56,955 | 4.1% |
[ 2.5% - 3.0% ] 2.76% | 46,789 | 7.8% |
[ 3.0% - 3.5% ] 3.09% | 291,996 | 8.0% |
[ 3.5% - 4.0% ] 3.75% | 16,528 | 6.5% |
[ 4.0% - 4.5% ] 4.15% | 26,155 | 6.8% |
[ 4.5% - 5.0% ] 4.98% | 26,257 | 20.6% |
[ 5.0% - 5.5% ] 5.02% | 6,091 | 4.9% |
[ 6.0% - 6.5% ] 6.33% | 38,142 | 9.6% |
[ 25.5% - 26.0% ] 25.96% | 235 | 21.4% |
[ 28.5% - 29.0% ] 28.57% | 630 | 18.2% |
[ 54.5% - 55.0% ] 54.98% | 1,768 | 12.5% |
[ 58.0% - 58.5% ] 58.30% | 1,602 | 38.5% |
[ 65.5% - 66.0% ] 65.78% | 900 | 58.3% |
[ 71.5% - 72.0% ] 71.84% | 8,157 | 6.2% |
[ 72.5% - 73.0% ] 72.89% | 760 | 23.1% |
[ 73.0% - 73.5% ] 73.15% | 596 | 42.9% |
[ 73.5% - 74.0% ] 73.79% | 1,442 | 10.7% |
[ 76.0% - 76.5% ] 76.04% | 1,828 | 9.1% |
[ 76.5% - 77.0% ] 76.99% | 843 | 33.3% |
[ 79.0% - 79.5% ] 79.27% | 2,074 | 15.3% |
[ 79.5% - 80.0% ] 79.92% | 4,184 | 21.6% |
[ 81.0% - 81.5% ] 81.19% | 1,308 | 7.7% |
[ 85.5% - 86.0% ] 85.85% | 1,088 | 32.1% |
[ 86.0% - 86.5% ] 86.29% | 992 | 31.0% |
[ 88.5% - 89.0% ] 88.91% | 3,389 | 23.0% |
[ 92.5% - 93.0% ] 92.76% | 4,614 | 28.2% |
[ 94.5% - 95.0% ] 94.53% | 950 | 12.5% |
[ 95.0% - 95.5% ] 95.40% | 3,128 | 78.2% |
[ 96.0% - 96.5% ] 96.20% | 2,156 | 25.2% |
[ 97.0% - 97.5% ] 97.43% | 778 | 31.6% |
[ 99.0% - 99.5% ] 99.43% | 353 | 50.0% |
[ 99.5% - 100.0% ] 100.00% | 239 | 100.0% |