Yup'ik Male Disability
COMPARE
Yup'ik
Select to Compare
Male Disability
Yup'ik Male Disability
12.8%
DISABILITY | MALES
0.0/ 100
METRIC RATING
288th/ 347
METRIC RANK
Yup'ik Male Disability Correlation Chart
The statistical analysis conducted on geographies consisting of 39,960,861 people shows a poor negative correlation between the proportion of Yup'ik and percentage of males with a disability in the United States with a correlation coefficient (R) of -0.137 and weighted average of 12.8%. On average, for every 1% (one percent) increase in Yup'ik within a typical geography, there is a decrease of 0.019% in percentage of males with a disability.
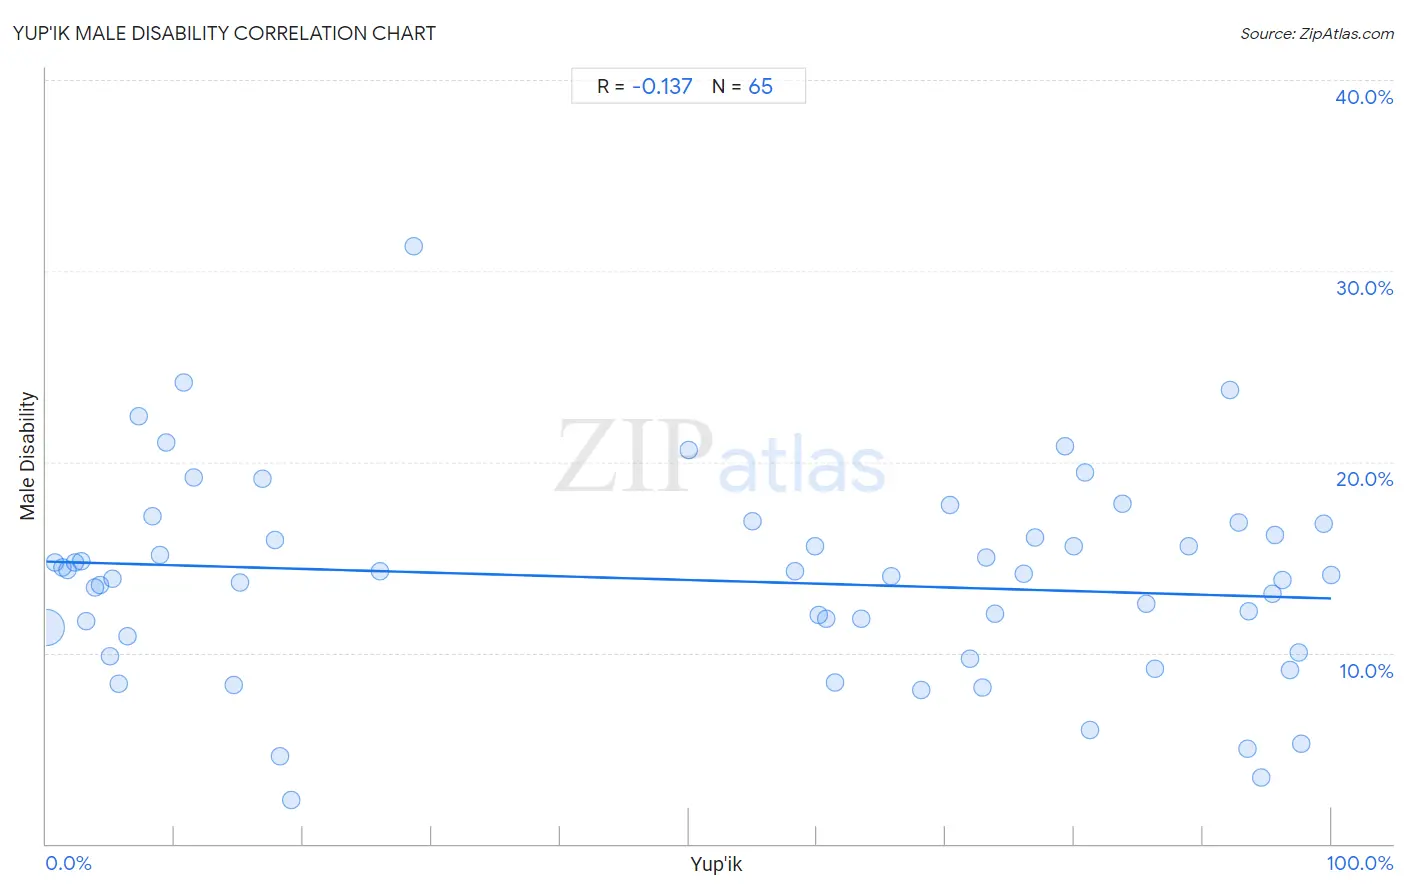
It is essential to understand that the correlation between the percentage of Yup'ik and percentage of males with a disability does not imply a direct cause-and-effect relationship. It remains uncertain whether the presence of Yup'ik influences an upward or downward trend in the level of percentage of males with a disability within an area, or if Yup'ik simply ended up residing in those areas with higher or lower levels of percentage of males with a disability due to other factors.
Demographics Similar to Yup'ik by Male Disability
In terms of male disability, the demographic groups most similar to Yup'ik are Cape Verdean (12.8%, a difference of 0.19%), Immigrants from Cabo Verde (12.8%, a difference of 0.19%), Scottish (12.8%, a difference of 0.26%), Spanish (12.7%, a difference of 0.31%), and Welsh (12.7%, a difference of 0.31%).
| Demographics | Rating | Rank | Male Disability |
| Sioux | 0.0 /100 | #281 | Tragic 12.7% |
| Irish | 0.0 /100 | #282 | Tragic 12.7% |
| Germans | 0.0 /100 | #283 | Tragic 12.7% |
| Spanish | 0.0 /100 | #284 | Tragic 12.7% |
| Welsh | 0.0 /100 | #285 | Tragic 12.7% |
| Scottish | 0.0 /100 | #286 | Tragic 12.8% |
| Cape Verdeans | 0.0 /100 | #287 | Tragic 12.8% |
| Yup'ik | 0.0 /100 | #288 | Tragic 12.8% |
| Immigrants from Cabo Verde | 0.0 /100 | #289 | Tragic 12.8% |
| Pima | 0.0 /100 | #290 | Tragic 12.8% |
| Whites/Caucasians | 0.0 /100 | #291 | Tragic 12.8% |
| English | 0.0 /100 | #292 | Tragic 12.8% |
| Yaqui | 0.0 /100 | #293 | Tragic 12.9% |
| Marshallese | 0.0 /100 | #294 | Tragic 12.9% |
| Immigrants from Micronesia | 0.0 /100 | #295 | Tragic 12.9% |
Yup'ik Male Disability Correlation Summary
| Measurement | Yup'ik Data | Male Disability Data |
| Minimum | 0.022% | 2.3% |
| Maximum | 100.0% | 31.3% |
| Range | 100.0% | 29.0% |
| Mean | 50.5% | 13.8% |
| Median | 60.7% | 14.1% |
| Interquartile 25% (IQ1) | 9.1% | 10.4% |
| Interquartile 75% (IQ3) | 84.7% | 16.4% |
| Interquartile Range (IQR) | 75.6% | 6.0% |
| Standard Deviation (Sample) | 37.0% | 5.2% |
| Standard Deviation (Population) | 36.7% | 5.2% |
Correlation Details
| Yup'ik Percentile | Sample Size | Male Disability |
[ 0.0% - 0.5% ] 0.022% | 38,686,862 | 11.3% |
[ 0.5% - 1.0% ] 0.66% | 263,209 | 14.7% |
[ 1.0% - 1.5% ] 1.22% | 184,111 | 14.5% |
[ 1.5% - 2.0% ] 1.66% | 92,710 | 14.3% |
[ 2.0% - 2.5% ] 2.28% | 95,408 | 14.8% |
[ 2.5% - 3.0% ] 2.77% | 57,299 | 14.8% |
[ 3.0% - 3.5% ] 3.10% | 321,211 | 11.7% |
[ 3.5% - 4.0% ] 3.76% | 24,258 | 13.5% |
[ 4.0% - 4.5% ] 4.16% | 27,609 | 13.5% |
[ 4.5% - 5.0% ] 4.95% | 31,565 | 9.8% |
[ 5.0% - 5.5% ] 5.12% | 59,649 | 13.9% |
[ 5.5% - 6.0% ] 5.67% | 3,087 | 8.4% |
[ 6.0% - 6.5% ] 6.33% | 38,793 | 10.9% |
[ 7.0% - 7.5% ] 7.18% | 1,588 | 22.4% |
[ 8.0% - 8.5% ] 8.26% | 109 | 17.1% |
[ 8.5% - 9.0% ] 8.88% | 439 | 15.1% |
[ 9.0% - 9.5% ] 9.31% | 1,707 | 21.0% |
[ 10.5% - 11.0% ] 10.71% | 2,027 | 24.2% |
[ 11.0% - 11.5% ] 11.49% | 383 | 19.2% |
[ 14.5% - 15.0% ] 14.63% | 41 | 8.3% |
[ 15.0% - 15.5% ] 15.07% | 836 | 13.7% |
[ 16.5% - 17.0% ] 16.84% | 95 | 19.1% |
[ 17.5% - 18.0% ] 17.78% | 90 | 15.9% |
[ 18.0% - 18.5% ] 18.20% | 912 | 4.6% |
[ 19.0% - 19.5% ] 19.11% | 450 | 2.3% |
[ 25.5% - 26.0% ] 25.96% | 235 | 14.3% |
[ 28.5% - 29.0% ] 28.57% | 630 | 31.3% |
[ 50.0% - 50.5% ] 50.00% | 864 | 20.6% |
[ 54.5% - 55.0% ] 54.98% | 1,768 | 16.9% |
[ 58.0% - 58.5% ] 58.30% | 1,602 | 14.2% |
[ 59.5% - 60.0% ] 59.78% | 92 | 15.6% |
[ 60.0% - 60.5% ] 60.14% | 715 | 12.0% |
[ 60.5% - 61.0% ] 60.74% | 2,175 | 11.8% |
[ 61.0% - 61.5% ] 61.34% | 551 | 8.5% |
[ 63.0% - 63.5% ] 63.45% | 2,577 | 11.8% |
[ 65.5% - 66.0% ] 65.78% | 900 | 14.0% |
[ 68.0% - 68.5% ] 68.12% | 6,312 | 8.1% |
[ 70.0% - 70.5% ] 70.36% | 830 | 17.7% |
[ 71.5% - 72.0% ] 71.84% | 8,157 | 9.7% |
[ 72.5% - 73.0% ] 72.89% | 760 | 8.2% |
[ 73.0% - 73.5% ] 73.15% | 596 | 15.0% |
[ 73.5% - 74.0% ] 73.79% | 1,442 | 12.1% |
[ 76.0% - 76.5% ] 76.04% | 1,828 | 14.1% |
[ 76.5% - 77.0% ] 76.99% | 843 | 16.0% |
[ 79.0% - 79.5% ] 79.27% | 2,316 | 20.8% |
[ 79.5% - 80.0% ] 79.92% | 4,184 | 15.6% |
[ 80.5% - 81.0% ] 80.82% | 146 | 19.4% |
[ 81.0% - 81.5% ] 81.19% | 1,308 | 6.0% |
[ 83.5% - 84.0% ] 83.77% | 616 | 17.8% |
[ 85.5% - 86.0% ] 85.63% | 5,358 | 12.5% |
[ 86.0% - 86.5% ] 86.29% | 992 | 9.2% |
[ 88.5% - 89.0% ] 88.91% | 3,389 | 15.6% |
[ 92.0% - 92.5% ] 92.11% | 190 | 23.8% |
[ 92.5% - 93.0% ] 92.76% | 4,614 | 16.8% |
[ 93.0% - 93.5% ] 93.49% | 614 | 5.0% |
[ 93.5% - 94.0% ] 93.59% | 234 | 12.2% |
[ 94.5% - 95.0% ] 94.53% | 950 | 3.5% |
[ 95.0% - 95.5% ] 95.40% | 3,128 | 13.1% |
[ 95.5% - 96.0% ] 95.59% | 1,178 | 16.1% |
[ 96.0% - 96.5% ] 96.20% | 2,209 | 13.8% |
[ 96.5% - 97.0% ] 96.77% | 62 | 9.1% |
[ 97.0% - 97.5% ] 97.43% | 778 | 10.0% |
[ 97.5% - 98.0% ] 97.67% | 430 | 5.3% |
[ 99.0% - 99.5% ] 99.43% | 353 | 16.7% |
[ 99.5% - 100.0% ] 100.00% | 487 | 14.1% |