Yup'ik vs Laotian Self-Care Disability

COMPARE

Yup'ik
Race
Ancestry
AfghanAfricanAlaska NativeAlaskan AthabascanAlbanianAleutAlsatianAmericanApacheArabArapahoArgentineanArmenianAssyrian/Chaldean/SyriacAustralianAustrianBahamianBangladeshiBarbadianBasqueBelgianBelizeanBermudanBhutaneseBlackfeetBolivianBrazilianBritishBritish West IndianBulgarianBurmeseCajunCambodianCanadianCape VerdeanCarpatho RusynCelticCentral AmericanCentral American IndianCherokeeCheyenneChickasawChileanChineseChippewaChoctawColombianColvilleComancheCosta RicanCreeCreekCroatianCrowCubanCypriotCzechCzechoslovakianDanishDelawareDominicanDutchDutch West IndianEastern EuropeanEcuadorianEgyptianEnglishEstonianEthiopianEuropeanFijianFilipinoFinnishFrenchFrench American IndianFrench CanadianGermanGerman RussianGhanaianGreekGuamanian/ChamorroGuatemalanGuyaneseHaitianHmongHonduranHopiHoumaHungarianIcelanderIndian (Asian)IndonesianInupiatIranianIraqiIrishIroquoisIsraeliItalianJamaicanJapaneseJordanianKenyanKiowaKoreanLatvianLebaneseLiberianLithuanianLumbeeLuxembourgerMacedonianMalaysianMalteseMarshalleseMenomineeMexicanMexican American IndianMongolianMoroccanNative HawaiianNavajoNepaleseNew ZealanderNicaraguanNigerianNorthern EuropeanNorwegianOkinawanOsageOttawaPaiutePakistaniPalestinianPanamanianParaguayanPennsylvania GermanPeruvianPimaPolishPortuguesePotawatomiPuebloPuerto RicanPuget Sound SalishRomanianRussianSalvadoranSamoanScandinavianScotch-IrishScottishSeminoleSenegaleseSerbianShoshoneSierra LeoneanSiouxSlavicSlovakSloveneSomaliSouth AfricanSouth AmericanSouth American IndianSoviet UnionSpaniardSpanishSpanish AmericanSpanish American IndianSri LankanSubsaharan AfricanSudaneseSwedishSwissSyrianTaiwaneseThaiTlingit-HaidaTohono O'OdhamTonganTrinidadian and TobagonianTsimshianTurkishU.S. Virgin IslanderUgandanUkrainianUruguayanUteVenezuelanVietnameseWelshWest IndianYakamaYaquiYugoslavianYumanYup'ikZimbabwean
Immigration
NonimmigrantsImmigrantsAfghanistanAfricaAlbaniaArgentinaArmeniaAsiaAustraliaAustriaBahamasBangladeshBarbadosBelarusBelgiumBelizeBoliviaBosnia and HerzegovinaBrazilBulgariaBurma/MyanmarCabo VerdeCambodiaCameroonCanadaCaribbeanCentral AmericaChileChinaColombiaCongoCosta RicaCroatiaCubaCzechoslovakiaDenmarkDominicaDominican RepublicEastern AfricaEastern AsiaEastern EuropeEcuadorEgyptEl SalvadorEnglandEritreaEthiopiaEuropeFijiFranceGermanyGhanaGreeceGrenadaGuatemalaGuyanaHaitiHondurasHong KongHungaryIndiaIndonesiaIranIraqIrelandIsraelItalyJamaicaJapanJordanKazakhstanKenyaKoreaKuwaitLaosLatin AmericaLatviaLebanonLiberiaLithuaniaMalaysiaMexicoMicronesiaMiddle AfricaMoldovaMoroccoNepalNetherlandsNicaraguaNigeriaNorth AmericaNorth MacedoniaNorthern AfricaNorthern EuropeNorwayOceaniaPakistanPanamaPeruPhilippinesPolandPortugalRomaniaRussiaSaudi ArabiaScotlandSenegalSerbiaSierra LeoneSingaporeSomaliaSouth AfricaSouth AmericaSouth Central AsiaSouth Eastern AsiaSouthern EuropeSpainSri LankaSt. Vincent and the GrenadinesSudanSwedenSwitzerlandSyriaTaiwanThailandTrinidad and TobagoTurkeyUgandaUkraineUruguayUzbekistanVenezuelaVietnamWest IndiesWestern AfricaWestern AsiaWestern EuropeYemenZaireZimbabweAzores
Laotian
Race
Ancestry
AfghanAfricanAlaska NativeAlaskan AthabascanAlbanianAleutAlsatianAmericanApacheArabArapahoArgentineanArmenianAssyrian/Chaldean/SyriacAustralianAustrianBahamianBangladeshiBarbadianBasqueBelgianBelizeanBermudanBhutaneseBlackfeetBolivianBrazilianBritishBritish West IndianBulgarianBurmeseCajunCambodianCanadianCape VerdeanCarpatho RusynCelticCentral AmericanCentral American IndianCherokeeCheyenneChickasawChileanChineseChippewaChoctawColombianColvilleComancheCosta RicanCreeCreekCroatianCrowCubanCypriotCzechCzechoslovakianDanishDelawareDominicanDutchDutch West IndianEastern EuropeanEcuadorianEgyptianEnglishEstonianEthiopianEuropeanFijianFilipinoFinnishFrenchFrench American IndianFrench CanadianGermanGerman RussianGhanaianGreekGuamanian/ChamorroGuatemalanGuyaneseHaitianHmongHonduranHopiHoumaHungarianIcelanderIndian (Asian)IndonesianInupiatIranianIraqiIrishIroquoisIsraeliItalianJamaicanJapaneseJordanianKenyanKiowaKoreanLaotianLatvianLebaneseLiberianLithuanianLumbeeLuxembourgerMacedonianMalaysianMalteseMarshalleseMenomineeMexicanMexican American IndianMongolianMoroccanNative HawaiianNavajoNepaleseNew ZealanderNicaraguanNigerianNorthern EuropeanNorwegianOkinawanOsageOttawaPaiutePakistaniPalestinianPanamanianParaguayanPennsylvania GermanPeruvianPimaPolishPortuguesePotawatomiPuebloPuerto RicanPuget Sound SalishRomanianRussianSalvadoranSamoanScandinavianScotch-IrishScottishSeminoleSenegaleseSerbianShoshoneSierra LeoneanSiouxSlavicSlovakSloveneSomaliSouth AfricanSouth AmericanSouth American IndianSoviet UnionSpaniardSpanishSpanish AmericanSpanish American IndianSri LankanSubsaharan AfricanSudaneseSwedishSwissSyrianTaiwaneseThaiTlingit-HaidaTohono O'OdhamTonganTrinidadian and TobagonianTsimshianTurkishU.S. Virgin IslanderUgandanUkrainianUruguayanUteVenezuelanVietnameseWelshWest IndianYakamaYaquiYugoslavianYumanZimbabwean
Immigration
NonimmigrantsImmigrantsAfghanistanAfricaAlbaniaArgentinaArmeniaAsiaAustraliaAustriaBahamasBangladeshBarbadosBelarusBelgiumBelizeBoliviaBosnia and HerzegovinaBrazilBulgariaBurma/MyanmarCabo VerdeCambodiaCameroonCanadaCaribbeanCentral AmericaChileChinaColombiaCongoCosta RicaCroatiaCubaCzechoslovakiaDenmarkDominicaDominican RepublicEastern AfricaEastern AsiaEastern EuropeEcuadorEgyptEl SalvadorEnglandEritreaEthiopiaEuropeFijiFranceGermanyGhanaGreeceGrenadaGuatemalaGuyanaHaitiHondurasHong KongHungaryIndiaIndonesiaIranIraqIrelandIsraelItalyJamaicaJapanJordanKazakhstanKenyaKoreaKuwaitLaosLatin AmericaLatviaLebanonLiberiaLithuaniaMalaysiaMexicoMicronesiaMiddle AfricaMoldovaMoroccoNepalNetherlandsNicaraguaNigeriaNorth AmericaNorth MacedoniaNorthern AfricaNorthern EuropeNorwayOceaniaPakistanPanamaPeruPhilippinesPolandPortugalRomaniaRussiaSaudi ArabiaScotlandSenegalSerbiaSierra LeoneSingaporeSomaliaSouth AfricaSouth AmericaSouth Central AsiaSouth Eastern AsiaSouthern EuropeSpainSri LankaSt. Vincent and the GrenadinesSudanSwedenSwitzerlandSyriaTaiwanThailandTrinidad and TobagoTurkeyUgandaUkraineUruguayUzbekistanVenezuelaVietnamWest IndiesWestern AfricaWestern AsiaWestern EuropeYemenZaireZimbabweAzores
Self-Care Disability
Income
Poverty
Unemployment
Labor Participation
Family Structure
Vehicle Availability
Education Level
Disability

Self-Care Disability Comparison

Yup'ik

Laotians

Exceptional
Excellent
1.9%
SELF-CARE DISABILITY
100.0/ 100
METRIC RATING
1st/ 347
METRIC RANK
2.4%
SELF-CARE DISABILITY
87.8/ 100
METRIC RATING
135th/ 347
METRIC RANK

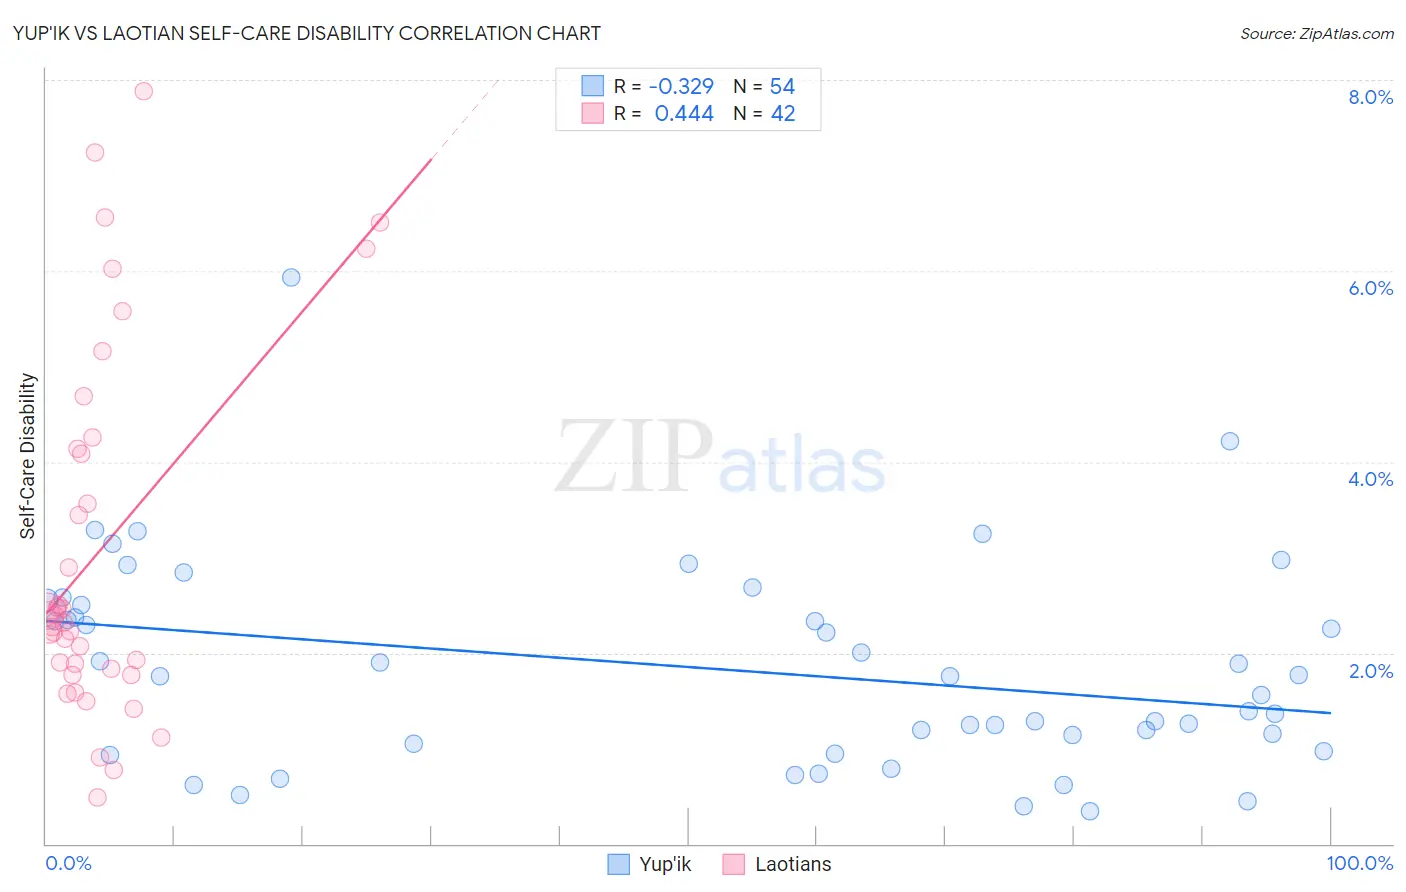
Yup'ik vs Laotian Self-Care Disability Correlation Chart

The statistical analysis conducted on geographies consisting of 39,934,897 people shows a mild negative correlation between the proportion of Yup'ik and percentage of population with self-care disability in the United States with a correlation coefficient (R) of -0.329 and weighted average of 1.9%. Similarly, the statistical analysis conducted on geographies consisting of 224,705,626 people shows a moderate positive correlation between the proportion of Laotians and percentage of population with self-care disability in the United States with a correlation coefficient (R) of 0.444 and weighted average of 2.4%, a difference of 29.0%.
Yup'ik vs Laotian Self-Care Disability

Self-Care Disability Correlation Summary

MeasurementYup'ikLaotian
Minimum0.35%0.49%
Maximum5.9%7.9%
Range5.6%7.4%
Mean1.8%3.1%
Median1.8%2.4%
Interquartile 25% (IQ1)1.1%1.8%
Interquartile 75% (IQ3)2.5%4.1%
Interquartile Range (IQR)1.5%2.3%
Standard Deviation (Sample)1.1%1.9%
Standard Deviation (Population)1.1%1.9%

Similar Demographics by Self-Care Disability

Demographics Similar to Yup'ik by Self-Care Disability

In terms of self-care disability, the demographic groups most similar to Yup'ik are Immigrants from India (2.0%, a difference of 8.2%), Thai (2.1%, a difference of 11.5%), Immigrants from Singapore (2.1%, a difference of 14.0%), Zimbabwean (2.2%, a difference of 15.1%), and Filipino (2.2%, a difference of 15.4%).
DemographicsRating | RankSelf-Care Disability
Yup'ik
100.0
/100
|
#1
Exceptional
1.9%
Immigrants | India
100.0
/100
|
#2
Exceptional
2.0%
Thais
100.0
/100
|
#3
Exceptional
2.1%
Immigrants | Singapore
100.0
/100
|
#4
Exceptional
2.1%
Zimbabweans
100.0
/100
|
#5
Exceptional
2.2%
Filipinos
100.0
/100
|
#6
Exceptional
2.2%
Immigrants | Bolivia
100.0
/100
|
#7
Exceptional
2.2%
Bolivians
100.0
/100
|
#8
Exceptional
2.2%
Immigrants | Nepal
100.0
/100
|
#9
Exceptional
2.2%
Sudanese
100.0
/100
|
#10
Exceptional
2.2%
Immigrants | South Central Asia
100.0
/100
|
#11
Exceptional
2.2%
Immigrants | Ethiopia
100.0
/100
|
#12
Exceptional
2.2%
Ethiopians
100.0
/100
|
#13
Exceptional
2.2%
Luxembourgers
100.0
/100
|
#14
Exceptional
2.2%
Okinawans
100.0
/100
|
#15
Exceptional
2.2%

Demographics Similar to Laotians by Self-Care Disability

In terms of self-care disability, the demographic groups most similar to Laotians are Russian (2.4%, a difference of 0.050%), South American Indian (2.4%, a difference of 0.070%), Austrian (2.4%, a difference of 0.080%), Immigrants from Colombia (2.4%, a difference of 0.090%), and Immigrants from South America (2.4%, a difference of 0.12%).
DemographicsRating | RankSelf-Care Disability
Immigrants | Hungary
89.6
/100
|
#128
Excellent
2.4%
Immigrants | Romania
89.3
/100
|
#129
Excellent
2.4%
Immigrants | Austria
89.0
/100
|
#130
Excellent
2.4%
Poles
88.9
/100
|
#131
Excellent
2.4%
Immigrants | South America
88.8
/100
|
#132
Excellent
2.4%
Immigrants | Colombia
88.5
/100
|
#133
Excellent
2.4%
Russians
88.2
/100
|
#134
Excellent
2.4%
Laotians
87.8
/100
|
#135
Excellent
2.4%
South American Indians
87.2
/100
|
#136
Excellent
2.4%
Austrians
87.0
/100
|
#137
Excellent
2.4%
Immigrants | Croatia
86.6
/100
|
#138
Excellent
2.4%
Sri Lankans
86.6
/100
|
#139
Excellent
2.4%
Immigrants | Uruguay
85.4
/100
|
#140
Excellent
2.4%
Alaska Natives
84.5
/100
|
#141
Excellent
2.4%
Immigrants | Peru
83.2
/100
|
#142
Excellent
2.4%