Uruguayan 1 or more Vehicles in Household
COMPARE
Uruguayan
Select to Compare
1 or more Vehicles in Household
Uruguayan 1 or more Vehicles in Household
88.8%
1+ VEHICLES AVAILABLE
7.0/ 100
METRIC RATING
222nd/ 347
METRIC RANK
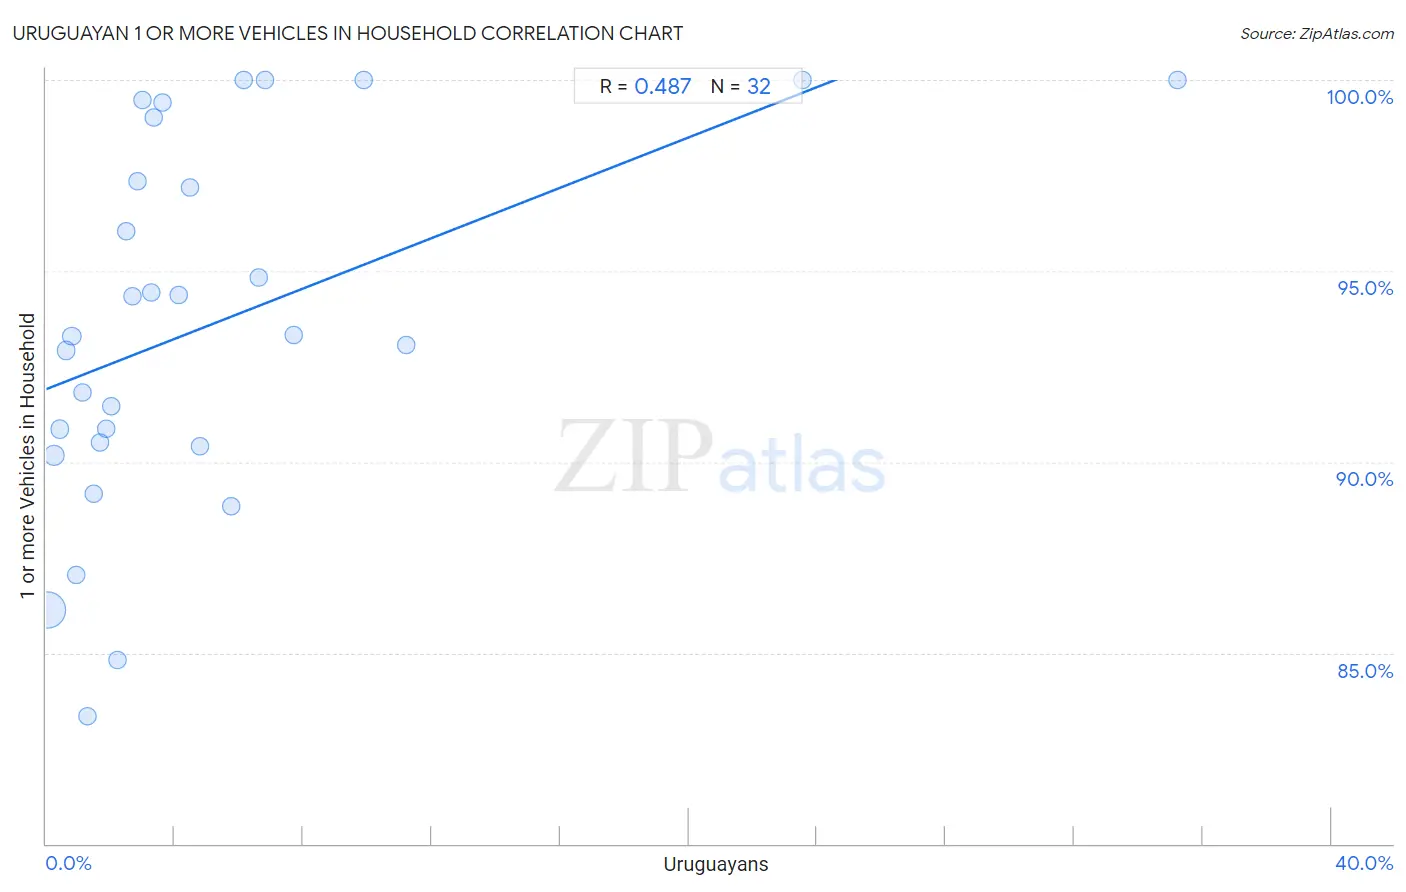
Uruguayan 1 or more Vehicles in Household Correlation Chart
The statistical analysis conducted on geographies consisting of 144,759,773 people shows a moderate positive correlation between the proportion of Uruguayans and percentage of households with 1 or more vehicles available in the United States with a correlation coefficient (R) of 0.487 and weighted average of 88.8%. On average, for every 1% (one percent) increase in Uruguayans within a typical geography, there is an increase of 0.33% in percentage of households with 1 or more vehicles available.
It is essential to understand that the correlation between the percentage of Uruguayans and percentage of households with 1 or more vehicles available does not imply a direct cause-and-effect relationship. It remains uncertain whether the presence of Uruguayans influences an upward or downward trend in the level of percentage of households with 1 or more vehicles available within an area, or if Uruguayans simply ended up residing in those areas with higher or lower levels of percentage of households with 1 or more vehicles available due to other factors.
Demographics Similar to Uruguayans by 1 or more Vehicles in Household
In terms of 1 or more vehicles in household, the demographic groups most similar to Uruguayans are Immigrants from South America (88.8%, a difference of 0.0%), Peruvian (88.8%, a difference of 0.050%), Immigrants from Hong Kong (88.7%, a difference of 0.050%), Cree (88.7%, a difference of 0.060%), and Immigrants from Zaire (88.8%, a difference of 0.070%).
| Demographics | Rating | Rank | 1 or more Vehicles in Household |
| Immigrants from Sri Lanka | 10.2 /100 | #215 | Poor 88.9% |
| Immigrants from Argentina | 9.4 /100 | #216 | Tragic 88.9% |
| Argentineans | 8.8 /100 | #217 | Tragic 88.9% |
| Ugandans | 8.7 /100 | #218 | Tragic 88.9% |
| Immigrants from Guatemala | 8.6 /100 | #219 | Tragic 88.9% |
| Immigrants from Zaire | 8.1 /100 | #220 | Tragic 88.8% |
| Peruvians | 7.9 /100 | #221 | Tragic 88.8% |
| Uruguayans | 7.0 /100 | #222 | Tragic 88.8% |
| Immigrants from South America | 7.0 /100 | #223 | Tragic 88.8% |
| Immigrants from Hong Kong | 6.2 /100 | #224 | Tragic 88.7% |
| Cree | 6.0 /100 | #225 | Tragic 88.7% |
| Cheyenne | 5.7 /100 | #226 | Tragic 88.7% |
| Ute | 5.6 /100 | #227 | Tragic 88.7% |
| Immigrants from Norway | 5.5 /100 | #228 | Tragic 88.7% |
| Immigrants from Romania | 5.4 /100 | #229 | Tragic 88.7% |
Uruguayan 1 or more Vehicles in Household Correlation Summary
| Measurement | Uruguayan Data | 1 or more Vehicles in Household Data |
| Minimum | 0.040% | 83.3% |
| Maximum | 35.2% | 100.0% |
| Range | 35.2% | 16.7% |
| Mean | 5.1% | 93.6% |
| Median | 2.9% | 93.3% |
| Interquartile 25% (IQ1) | 1.4% | 90.4% |
| Interquartile 75% (IQ3) | 5.9% | 98.2% |
| Interquartile Range (IQR) | 4.6% | 7.7% |
| Standard Deviation (Sample) | 7.1% | 4.8% |
| Standard Deviation (Population) | 7.0% | 4.7% |
Correlation Details
| Uruguayan Percentile | Sample Size | 1 or more Vehicles in Household |
[ 0.0% - 0.5% ] 0.040% | 126,087,490 | 86.1% |
[ 0.0% - 0.5% ] 0.25% | 11,787,434 | 90.2% |
[ 0.0% - 0.5% ] 0.42% | 2,735,443 | 90.9% |
[ 0.5% - 1.0% ] 0.61% | 1,673,075 | 92.9% |
[ 0.5% - 1.0% ] 0.80% | 874,768 | 93.3% |
[ 0.5% - 1.0% ] 0.94% | 519,332 | 87.1% |
[ 1.0% - 1.5% ] 1.13% | 223,111 | 91.8% |
[ 1.0% - 1.5% ] 1.29% | 257,352 | 83.3% |
[ 1.0% - 1.5% ] 1.48% | 237,582 | 89.2% |
[ 1.5% - 2.0% ] 1.67% | 133,798 | 90.5% |
[ 1.5% - 2.0% ] 1.85% | 71,071 | 90.9% |
[ 2.0% - 2.5% ] 2.02% | 52,551 | 91.4% |
[ 2.0% - 2.5% ] 2.23% | 69,004 | 84.8% |
[ 2.0% - 2.5% ] 2.50% | 9,969 | 96.0% |
[ 2.5% - 3.0% ] 2.69% | 1,747 | 94.3% |
[ 2.5% - 3.0% ] 2.83% | 1,659 | 97.3% |
[ 2.5% - 3.0% ] 3.00% | 1,067 | 99.5% |
[ 3.0% - 3.5% ] 3.28% | 1,250 | 94.4% |
[ 3.0% - 3.5% ] 3.36% | 506 | 99.0% |
[ 3.5% - 4.0% ] 3.61% | 887 | 99.4% |
[ 4.0% - 4.5% ] 4.11% | 7,857 | 94.4% |
[ 4.0% - 4.5% ] 4.46% | 830 | 97.2% |
[ 4.5% - 5.0% ] 4.79% | 313 | 90.4% |
[ 5.5% - 6.0% ] 5.75% | 2,367 | 88.8% |
[ 6.0% - 6.5% ] 6.15% | 179 | 100.0% |
[ 6.5% - 7.0% ] 6.63% | 4,553 | 94.8% |
[ 6.5% - 7.0% ] 6.79% | 324 | 100.0% |
[ 7.5% - 8.0% ] 7.69% | 611 | 93.3% |
[ 9.5% - 10.0% ] 9.89% | 3,114 | 100.0% |
[ 11.0% - 11.5% ] 11.20% | 250 | 93.1% |
[ 23.5% - 24.0% ] 23.56% | 191 | 100.0% |
[ 35.0% - 35.5% ] 35.23% | 88 | 100.0% |