Uruguayan 2 or more Vehicles in Household
COMPARE
Uruguayan
Select to Compare
2 or more Vehicles in Household
Uruguayan 2 or more Vehicles in Household
52.7%
2+ VEHICLES AVAILABLE
0.7/ 100
METRIC RATING
255th/ 347
METRIC RANK
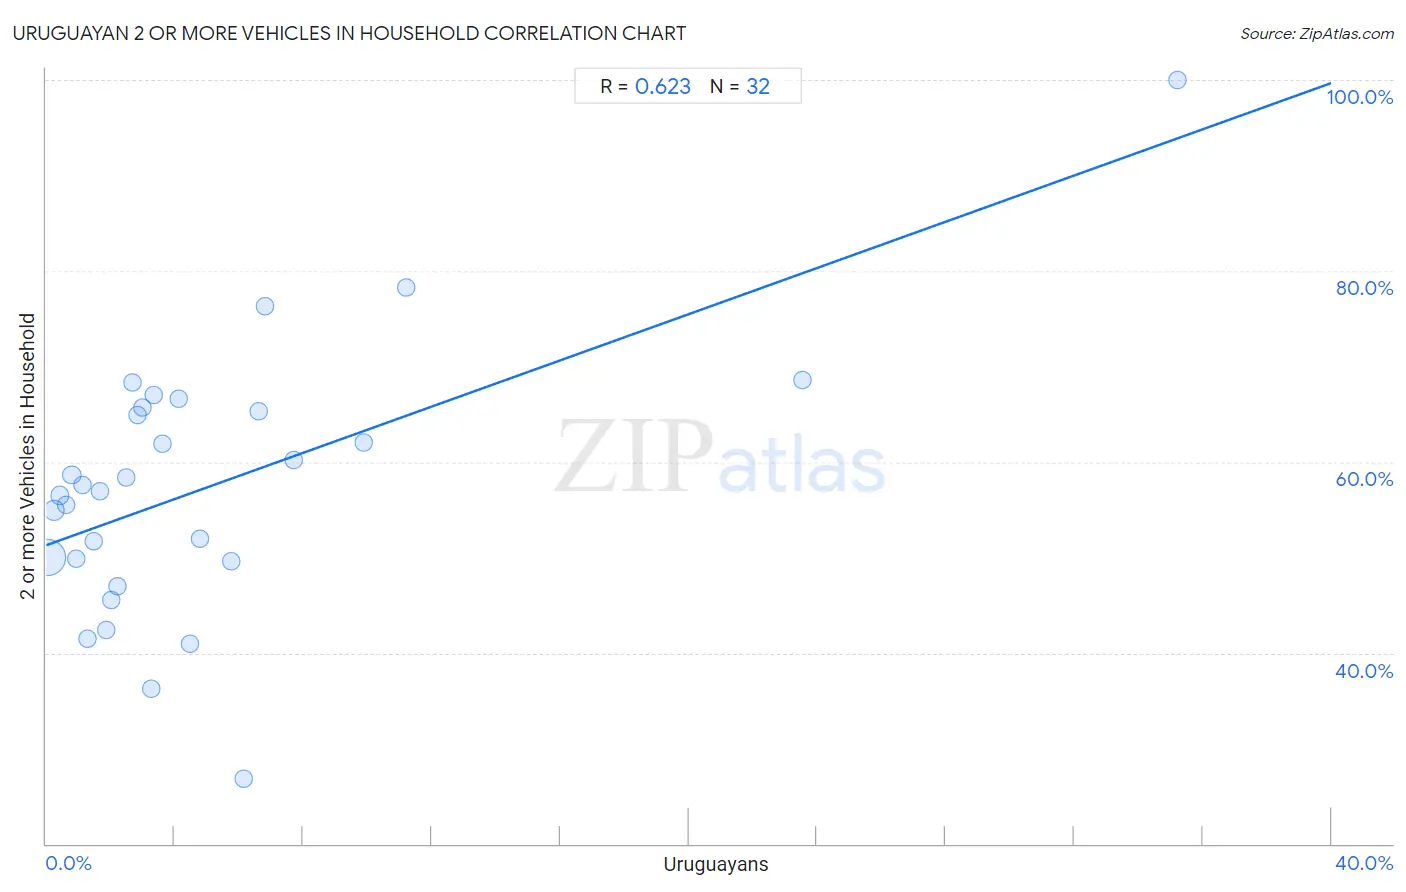
Uruguayan 2 or more Vehicles in Household Correlation Chart
The statistical analysis conducted on geographies consisting of 144,759,773 people shows a significant positive correlation between the proportion of Uruguayans and percentage of households with 2 or more vehicles available in the United States with a correlation coefficient (R) of 0.623 and weighted average of 52.7%. On average, for every 1% (one percent) increase in Uruguayans within a typical geography, there is an increase of 1.2% in percentage of households with 2 or more vehicles available.
It is essential to understand that the correlation between the percentage of Uruguayans and percentage of households with 2 or more vehicles available does not imply a direct cause-and-effect relationship. It remains uncertain whether the presence of Uruguayans influences an upward or downward trend in the level of percentage of households with 2 or more vehicles available within an area, or if Uruguayans simply ended up residing in those areas with higher or lower levels of percentage of households with 2 or more vehicles available due to other factors.
Demographics Similar to Uruguayans by 2 or more Vehicles in Household
In terms of 2 or more vehicles in household, the demographic groups most similar to Uruguayans are Immigrants from Malaysia (52.7%, a difference of 0.030%), Immigrants from Eritrea (52.6%, a difference of 0.040%), Immigrants from Hong Kong (52.6%, a difference of 0.18%), Nigerian (52.8%, a difference of 0.22%), and Immigrants from Portugal (52.8%, a difference of 0.27%).
| Demographics | Rating | Rank | 2 or more Vehicles in Household |
| Colombians | 1.1 /100 | #248 | Tragic 52.9% |
| Immigrants from Brazil | 1.0 /100 | #249 | Tragic 52.8% |
| Mongolians | 1.0 /100 | #250 | Tragic 52.8% |
| Immigrants from Sudan | 1.0 /100 | #251 | Tragic 52.8% |
| Immigrants from Portugal | 1.0 /100 | #252 | Tragic 52.8% |
| Nigerians | 0.9 /100 | #253 | Tragic 52.8% |
| Immigrants from Malaysia | 0.8 /100 | #254 | Tragic 52.7% |
| Uruguayans | 0.7 /100 | #255 | Tragic 52.7% |
| Immigrants from Eritrea | 0.7 /100 | #256 | Tragic 52.6% |
| Immigrants from Hong Kong | 0.6 /100 | #257 | Tragic 52.6% |
| Central American Indians | 0.6 /100 | #258 | Tragic 52.5% |
| Alsatians | 0.6 /100 | #259 | Tragic 52.5% |
| Immigrants from Bahamas | 0.5 /100 | #260 | Tragic 52.5% |
| Immigrants from Australia | 0.5 /100 | #261 | Tragic 52.4% |
| Immigrants from Northern Africa | 0.4 /100 | #262 | Tragic 52.3% |
Uruguayan 2 or more Vehicles in Household Correlation Summary
| Measurement | Uruguayan Data | 2 or more Vehicles in Household Data |
| Minimum | 0.040% | 26.8% |
| Maximum | 35.2% | 100.0% |
| Range | 35.2% | 73.2% |
| Mean | 5.1% | 57.4% |
| Median | 2.9% | 57.3% |
| Interquartile 25% (IQ1) | 1.4% | 49.8% |
| Interquartile 75% (IQ3) | 5.9% | 65.5% |
| Interquartile Range (IQR) | 4.6% | 15.7% |
| Standard Deviation (Sample) | 7.1% | 13.8% |
| Standard Deviation (Population) | 7.0% | 13.6% |
Correlation Details
| Uruguayan Percentile | Sample Size | 2 or more Vehicles in Household |
[ 0.0% - 0.5% ] 0.040% | 126,087,490 | 50.0% |
[ 0.0% - 0.5% ] 0.25% | 11,787,434 | 54.9% |
[ 0.0% - 0.5% ] 0.42% | 2,735,443 | 56.5% |
[ 0.5% - 1.0% ] 0.61% | 1,673,075 | 55.5% |
[ 0.5% - 1.0% ] 0.80% | 874,768 | 58.6% |
[ 0.5% - 1.0% ] 0.94% | 519,332 | 49.9% |
[ 1.0% - 1.5% ] 1.13% | 223,111 | 57.6% |
[ 1.0% - 1.5% ] 1.29% | 257,352 | 41.5% |
[ 1.0% - 1.5% ] 1.48% | 237,582 | 51.7% |
[ 1.5% - 2.0% ] 1.67% | 133,798 | 57.0% |
[ 1.5% - 2.0% ] 1.85% | 71,071 | 42.4% |
[ 2.0% - 2.5% ] 2.02% | 52,551 | 45.5% |
[ 2.0% - 2.5% ] 2.23% | 69,004 | 47.0% |
[ 2.0% - 2.5% ] 2.50% | 9,969 | 58.3% |
[ 2.5% - 3.0% ] 2.69% | 1,747 | 68.3% |
[ 2.5% - 3.0% ] 2.83% | 1,659 | 64.9% |
[ 2.5% - 3.0% ] 3.00% | 1,067 | 65.7% |
[ 3.0% - 3.5% ] 3.28% | 1,250 | 36.2% |
[ 3.0% - 3.5% ] 3.36% | 506 | 67.0% |
[ 3.5% - 4.0% ] 3.61% | 887 | 61.9% |
[ 4.0% - 4.5% ] 4.11% | 7,857 | 66.6% |
[ 4.0% - 4.5% ] 4.46% | 830 | 40.9% |
[ 4.5% - 5.0% ] 4.79% | 313 | 52.0% |
[ 5.5% - 6.0% ] 5.75% | 2,367 | 49.6% |
[ 6.0% - 6.5% ] 6.15% | 179 | 26.8% |
[ 6.5% - 7.0% ] 6.63% | 4,553 | 65.3% |
[ 6.5% - 7.0% ] 6.79% | 324 | 76.3% |
[ 7.5% - 8.0% ] 7.69% | 611 | 60.2% |
[ 9.5% - 10.0% ] 9.89% | 3,114 | 62.0% |
[ 11.0% - 11.5% ] 11.20% | 250 | 78.2% |
[ 23.5% - 24.0% ] 23.56% | 191 | 68.6% |
[ 35.0% - 35.5% ] 35.23% | 88 | 100.0% |