Trinidadian and Tobagonian Unemployment Among Youth under 25 years

COMPARE

Trinidadian and Tobagonian
Race
Ancestry
AfghanAfricanAlaska NativeAlaskan AthabascanAlbanianAleutAlsatianAmericanApacheArabArapahoArgentineanArmenianAssyrian/Chaldean/SyriacAustralianAustrianBahamianBangladeshiBarbadianBasqueBelgianBelizeanBermudanBhutaneseBlackfeetBolivianBrazilianBritishBritish West IndianBulgarianBurmeseCajunCambodianCanadianCape VerdeanCarpatho RusynCelticCentral AmericanCentral American IndianCherokeeCheyenneChickasawChileanChineseChippewaChoctawColombianColvilleComancheCosta RicanCreeCreekCroatianCrowCubanCypriotCzechCzechoslovakianDanishDelawareDominicanDutchDutch West IndianEastern EuropeanEcuadorianEgyptianEnglishEstonianEthiopianEuropeanFijianFilipinoFinnishFrenchFrench American IndianFrench CanadianGermanGerman RussianGhanaianGreekGuamanian/ChamorroGuatemalanGuyaneseHaitianHmongHonduranHopiHoumaHungarianIcelanderIndian (Asian)IndonesianInupiatIranianIraqiIrishIroquoisIsraeliItalianJamaicanJapaneseJordanianKenyanKiowaKoreanLaotianLatvianLebaneseLiberianLithuanianLumbeeLuxembourgerMacedonianMalaysianMalteseMarshalleseMenomineeMexicanMexican American IndianMongolianMoroccanNative HawaiianNavajoNepaleseNew ZealanderNicaraguanNigerianNorthern EuropeanNorwegianOkinawanOsageOttawaPaiutePakistaniPalestinianPanamanianParaguayanPennsylvania GermanPeruvianPimaPolishPortuguesePotawatomiPuebloPuerto RicanPuget Sound SalishRomanianRussianSalvadoranSamoanScandinavianScotch-IrishScottishSeminoleSenegaleseSerbianShoshoneSierra LeoneanSiouxSlavicSlovakSloveneSomaliSouth AfricanSouth AmericanSouth American IndianSoviet UnionSpaniardSpanishSpanish AmericanSpanish American IndianSri LankanSubsaharan AfricanSudaneseSwedishSwissSyrianTaiwaneseThaiTlingit-HaidaTohono O'OdhamTonganTrinidadian and TobagonianTsimshianTurkishU.S. Virgin IslanderUgandanUkrainianUruguayanUteVenezuelanVietnameseWelshWest IndianYakamaYaquiYugoslavianYumanYup'ikZimbabwean
Immigration
NonimmigrantsImmigrantsAfghanistanAfricaAlbaniaArgentinaArmeniaAsiaAustraliaAustriaBahamasBangladeshBarbadosBelarusBelgiumBelizeBoliviaBosnia and HerzegovinaBrazilBulgariaBurma/MyanmarCabo VerdeCambodiaCameroonCanadaCaribbeanCentral AmericaChileChinaColombiaCongoCosta RicaCroatiaCubaCzechoslovakiaDenmarkDominicaDominican RepublicEastern AfricaEastern AsiaEastern EuropeEcuadorEgyptEl SalvadorEnglandEritreaEthiopiaEuropeFijiFranceGermanyGhanaGreeceGrenadaGuatemalaGuyanaHaitiHondurasHong KongHungaryIndiaIndonesiaIranIraqIrelandIsraelItalyJamaicaJapanJordanKazakhstanKenyaKoreaKuwaitLaosLatin AmericaLatviaLebanonLiberiaLithuaniaMalaysiaMexicoMicronesiaMiddle AfricaMoldovaMoroccoNepalNetherlandsNicaraguaNigeriaNorth AmericaNorth MacedoniaNorthern AfricaNorthern EuropeNorwayOceaniaPakistanPanamaPeruPhilippinesPolandPortugalRomaniaRussiaSaudi ArabiaScotlandSenegalSerbiaSierra LeoneSingaporeSomaliaSouth AfricaSouth AmericaSouth Central AsiaSouth Eastern AsiaSouthern EuropeSpainSri LankaSt. Vincent and the GrenadinesSudanSwedenSwitzerlandSyriaTaiwanThailandTrinidad and TobagoTurkeyUgandaUkraineUruguayUzbekistanVenezuelaVietnamWest IndiesWestern AfricaWestern AsiaWestern EuropeYemenZaireZimbabweAzores
Select to Compare
Race
Ancestry
AfghanAfricanAlaska NativeAlaskan AthabascanAlbanianAleutAlsatianAmericanApacheArabArapahoArgentineanArmenianAssyrian/Chaldean/SyriacAustralianAustrianBahamianBangladeshiBarbadianBasqueBelgianBelizeanBermudanBhutaneseBlackfeetBolivianBrazilianBritishBritish West IndianBulgarianBurmeseCajunCambodianCanadianCape VerdeanCarpatho RusynCelticCentral AmericanCentral American IndianCherokeeCheyenneChickasawChileanChineseChippewaChoctawColombianColvilleComancheCosta RicanCreeCreekCroatianCrowCubanCypriotCzechCzechoslovakianDanishDelawareDominicanDutchDutch West IndianEastern EuropeanEcuadorianEgyptianEnglishEstonianEthiopianEuropeanFijianFilipinoFinnishFrenchFrench American IndianFrench CanadianGermanGerman RussianGhanaianGreekGuamanian/ChamorroGuatemalanGuyaneseHaitianHmongHonduranHopiHoumaHungarianIcelanderIndian (Asian)IndonesianInupiatIranianIraqiIrishIroquoisIsraeliItalianJamaicanJapaneseJordanianKenyanKiowaKoreanLaotianLatvianLebaneseLiberianLithuanianLumbeeLuxembourgerMacedonianMalaysianMalteseMarshalleseMenomineeMexicanMexican American IndianMongolianMoroccanNative HawaiianNavajoNepaleseNew ZealanderNicaraguanNigerianNorthern EuropeanNorwegianOkinawanOsageOttawaPaiutePakistaniPalestinianPanamanianParaguayanPennsylvania GermanPeruvianPimaPolishPortuguesePotawatomiPuebloPuerto RicanPuget Sound SalishRomanianRussianSalvadoranSamoanScandinavianScotch-IrishScottishSeminoleSenegaleseSerbianShoshoneSierra LeoneanSiouxSlavicSlovakSloveneSomaliSouth AfricanSouth AmericanSouth American IndianSoviet UnionSpaniardSpanishSpanish AmericanSpanish American IndianSri LankanSubsaharan AfricanSudaneseSwedishSwissSyrianTaiwaneseThaiTlingit-HaidaTohono O'OdhamTonganTsimshianTurkishU.S. Virgin IslanderUgandanUkrainianUruguayanUteVenezuelanVietnameseWelshWest IndianYakamaYaquiYugoslavianYumanYup'ikZimbabwean
Immigration
NonimmigrantsImmigrantsAfghanistanAfricaAlbaniaArgentinaArmeniaAsiaAustraliaAustriaBahamasBangladeshBarbadosBelarusBelgiumBelizeBoliviaBosnia and HerzegovinaBrazilBulgariaBurma/MyanmarCabo VerdeCambodiaCameroonCanadaCaribbeanCentral AmericaChileChinaColombiaCongoCosta RicaCroatiaCubaCzechoslovakiaDenmarkDominicaDominican RepublicEastern AfricaEastern AsiaEastern EuropeEcuadorEgyptEl SalvadorEnglandEritreaEthiopiaEuropeFijiFranceGermanyGhanaGreeceGrenadaGuatemalaGuyanaHaitiHondurasHong KongHungaryIndiaIndonesiaIranIraqIrelandIsraelItalyJamaicaJapanJordanKazakhstanKenyaKoreaKuwaitLaosLatin AmericaLatviaLebanonLiberiaLithuaniaMalaysiaMexicoMicronesiaMiddle AfricaMoldovaMoroccoNepalNetherlandsNicaraguaNigeriaNorth AmericaNorth MacedoniaNorthern AfricaNorthern EuropeNorwayOceaniaPakistanPanamaPeruPhilippinesPolandPortugalRomaniaRussiaSaudi ArabiaScotlandSenegalSerbiaSierra LeoneSingaporeSomaliaSouth AfricaSouth AmericaSouth Central AsiaSouth Eastern AsiaSouthern EuropeSpainSri LankaSt. Vincent and the GrenadinesSudanSwedenSwitzerlandSyriaTaiwanThailandTrinidad and TobagoTurkeyUgandaUkraineUruguayUzbekistanVenezuelaVietnamWest IndiesWestern AfricaWestern AsiaWestern EuropeYemenZaireZimbabweAzores
Unemployment Among Youth under 25 years
Income
Poverty
Unemployment
Labor Participation
Family Structure
Vehicle Availability
Education Level
Disability

Trinidadian and Tobagonian Unemployment Among Youth under 25 years
Tragic

14.6%
UNEMPLOYMENT | YOUTH < 25
0.0/ 100
METRIC RATING
322nd/ 347
METRIC RANK

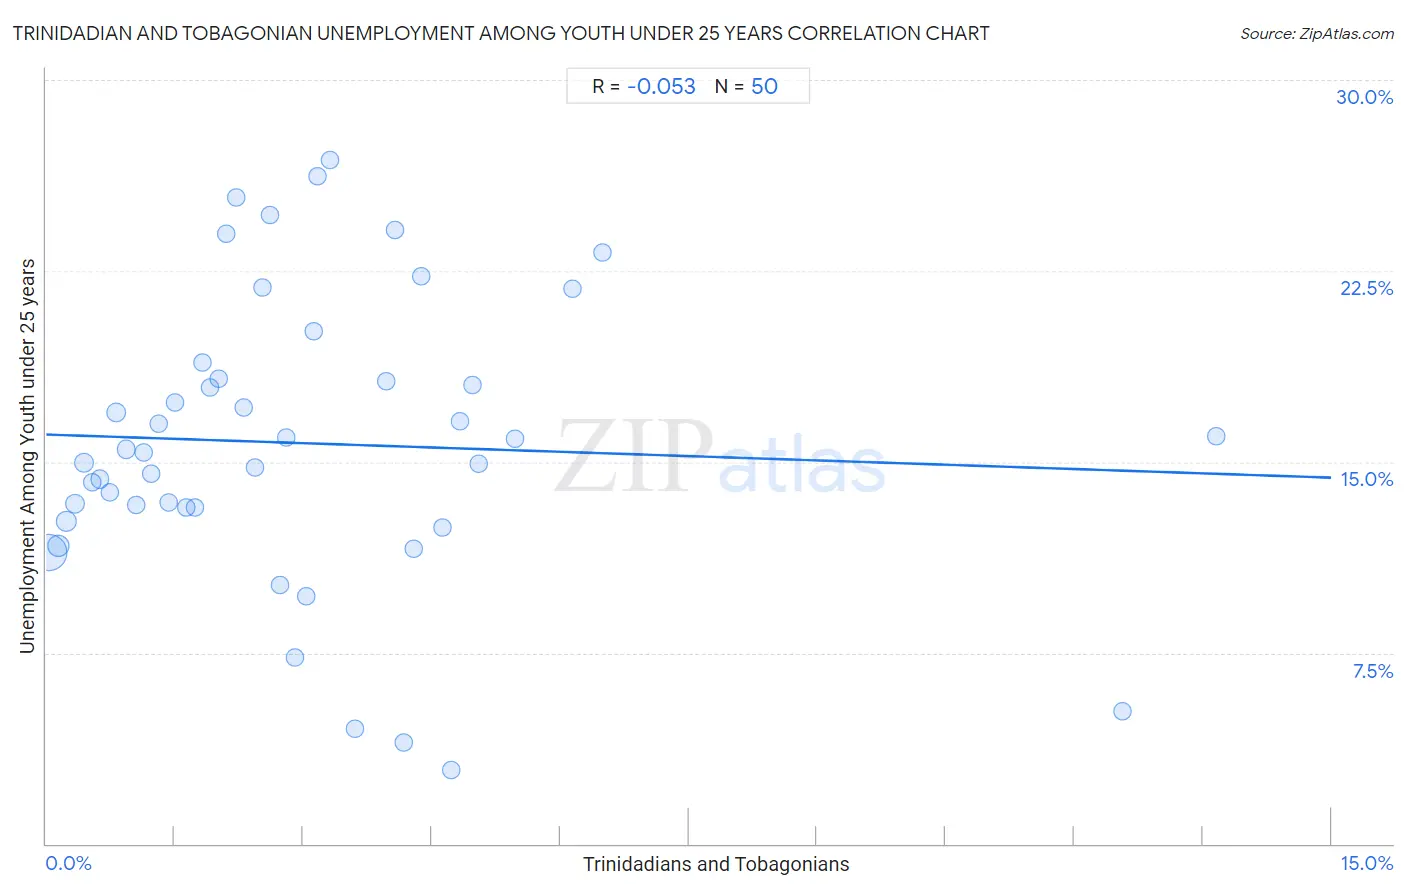
Trinidadian and Tobagonian Unemployment Among Youth under 25 years Correlation Chart

The statistical analysis conducted on geographies consisting of 218,912,692 people shows a slight negative correlation between the proportion of Trinidadians and Tobagonians and unemployment rate among youth under the age of 25 in the United States with a correlation coefficient (R) of -0.053 and weighted average of 14.6%. On average, for every 1% (one percent) increase in Trinidadians and Tobagonians within a typical geography, there is a decrease of 0.11% in unemployment rate among youth under the age of 25.
Trinidadian and Tobagonian Unemployment Among Youth under 25 years
It is essential to understand that the correlation between the percentage of Trinidadians and Tobagonians and unemployment rate among youth under the age of 25 does not imply a direct cause-and-effect relationship. It remains uncertain whether the presence of Trinidadians and Tobagonians influences an upward or downward trend in the level of unemployment rate among youth under the age of 25 within an area, or if Trinidadians and Tobagonians simply ended up residing in those areas with higher or lower levels of unemployment rate among youth under the age of 25 due to other factors.

Demographics Similar to Trinidadians and Tobagonians by Unemployment Among Youth under 25 years

In terms of unemployment among youth under 25 years, the demographic groups most similar to Trinidadians and Tobagonians are Cheyenne (14.6%, a difference of 0.070%), Immigrants from Trinidad and Tobago (14.6%, a difference of 0.090%), Barbadian (14.6%, a difference of 0.23%), West Indian (14.6%, a difference of 0.27%), and Immigrants from Dominica (14.6%, a difference of 0.31%).
DemographicsRating | RankUnemployment Among Youth under 25 years
Sioux
0.0
/100
|
#315
Tragic
14.4%
Natives/Alaskans
0.0
/100
|
#316
Tragic
14.5%
Blacks/African Americans
0.0
/100
|
#317
Tragic
14.5%
Immigrants from Dominica
0.0
/100
|
#318
Tragic
14.6%
West Indians
0.0
/100
|
#319
Tragic
14.6%
Barbadians
0.0
/100
|
#320
Tragic
14.6%
Cheyenne
0.0
/100
|
#321
Tragic
14.6%
Trinidadians and Tobagonians
0.0
/100
|
#322
Tragic
14.6%
Immigrants from Trinidad and Tobago
0.0
/100
|
#323
Tragic
14.6%
Immigrants from Jamaica
0.0
/100
|
#324
Tragic
14.8%
Alaska Natives
0.0
/100
|
#325
Tragic
14.9%
Immigrants from Barbados
0.0
/100
|
#326
Tragic
15.2%
British West Indians
0.0
/100
|
#327
Tragic
15.5%
Immigrants from Dominican Republic
0.0
/100
|
#328
Tragic
15.6%
Immigrants from Yemen
0.0
/100
|
#329
Tragic
15.6%

Trinidadian and Tobagonian Unemployment Among Youth under 25 years Correlation Summary

MeasurementTrinidadian and Tobagonian DataUnemployment Among Youth under 25 years Data
Minimum0.036%2.9%
Maximum13.7%26.9%
Range13.6%24.0%
Mean3.0%15.7%
Median2.5%15.4%
Interquartile 25% (IQ1)1.2%13.2%
Interquartile 75% (IQ3)4.2%18.3%
Interquartile Range (IQR)2.9%5.1%
Standard Deviation (Sample)2.7%5.7%
Standard Deviation (Population)2.6%5.6%

Correlation Details

Trinidadian and Tobagonian PercentileSample SizeUnemployment Among Youth under 25 years
[
0.0%
-
0.5%
]
0.036%
132,643,82511.5%
[
0.0%
-
0.5%
]
0.14%
32,168,90511.7%
[
0.0%
-
0.5%
]
0.23%
16,329,08612.7%
[
0.0%
-
0.5%
]
0.34%
8,686,49013.4%
[
0.0%
-
0.5%
]
0.44%
5,025,21015.0%
[
0.5%
-
1.0%
]
0.54%
3,197,24014.2%
[
0.5%
-
1.0%
]
0.63%
2,387,73914.3%
[
0.5%
-
1.0%
]
0.75%
2,087,39013.8%
[
0.5%
-
1.0%
]
0.82%
9,458,43816.9%
[
0.5%
-
1.0%
]
0.93%
846,58515.5%
[
1.0%
-
1.5%
]
1.05%
686,28213.3%
[
1.0%
-
1.5%
]
1.13%
844,31815.4%
[
1.0%
-
1.5%
]
1.23%
836,15514.5%
[
1.0%
-
1.5%
]
1.31%
497,00816.5%
[
1.0%
-
1.5%
]
1.42%
518,94913.4%
[
1.5%
-
2.0%
]
1.51%
226,29417.3%
[
1.5%
-
2.0%
]
1.63%
209,49813.2%
[
1.5%
-
2.0%
]
1.73%
210,07513.2%
[
1.5%
-
2.0%
]
1.82%
214,29518.9%
[
1.5%
-
2.0%
]
1.91%
176,40217.9%
[
2.0%
-
2.5%
]
2.01%
113,27018.3%
[
2.0%
-
2.5%
]
2.09%
76,30124.0%
[
2.0%
-
2.5%
]
2.22%
49,43525.4%
[
2.0%
-
2.5%
]
2.30%
209,42317.2%
[
2.0%
-
2.5%
]
2.43%
115,79114.8%
[
2.5%
-
3.0%
]
2.52%
99,70821.9%
[
2.5%
-
3.0%
]
2.61%
18,75524.7%
[
2.5%
-
3.0%
]
2.73%
41,79710.2%
[
2.5%
-
3.0%
]
2.81%
26,54716.0%
[
2.5%
-
3.0%
]
2.90%
63,5227.3%
[
3.0%
-
3.5%
]
3.04%
5279.7%
[
3.0%
-
3.5%
]
3.12%
3,04220.1%
[
3.0%
-
3.5%
]
3.16%
24,99426.2%
[
3.0%
-
3.5%
]
3.31%
73,87926.9%
[
3.5%
-
4.0%
]
3.61%
8,2604.5%
[
3.5%
-
4.0%
]
3.97%
48,18118.2%
[
4.0%
-
4.5%
]
4.07%
87,69824.1%
[
4.0%
-
4.5%
]
4.17%
10,4954.0%
[
4.0%
-
4.5%
]
4.29%
5,93811.6%
[
4.0%
-
4.5%
]
4.38%
150,38722.3%
[
4.5%
-
5.0%
]
4.62%
101,05312.4%
[
4.5%
-
5.0%
]
4.73%
1,3122.9%
[
4.5%
-
5.0%
]
4.83%
100,08216.6%
[
4.5%
-
5.0%
]
4.98%
51,15318.0%
[
5.0%
-
5.5%
]
5.05%
66,26214.9%
[
5.0%
-
5.5%
]
5.47%
78,50615.9%
[
6.0%
-
6.5%
]
6.14%
29,82021.8%
[
6.0%
-
6.5%
]
6.49%
1,51023.2%
[
12.5%
-
13.0%
]
12.56%
4,1795.2%
[
13.5%
-
14.0%
]
13.66%
68116.0%