Trinidadian and Tobagonian Disability Age Under 5

COMPARE

Trinidadian and Tobagonian
Race
Ancestry
AfghanAfricanAlaska NativeAlaskan AthabascanAlbanianAleutAlsatianAmericanApacheArabArapahoArgentineanArmenianAssyrian/Chaldean/SyriacAustralianAustrianBahamianBangladeshiBarbadianBasqueBelgianBelizeanBermudanBhutaneseBlackfeetBolivianBrazilianBritishBritish West IndianBulgarianBurmeseCajunCambodianCanadianCape VerdeanCarpatho RusynCelticCentral AmericanCentral American IndianCherokeeCheyenneChickasawChileanChineseChippewaChoctawColombianColvilleComancheCosta RicanCreeCreekCroatianCrowCubanCypriotCzechCzechoslovakianDanishDelawareDominicanDutchDutch West IndianEastern EuropeanEcuadorianEgyptianEnglishEstonianEthiopianEuropeanFijianFilipinoFinnishFrenchFrench American IndianFrench CanadianGermanGerman RussianGhanaianGreekGuamanian/ChamorroGuatemalanGuyaneseHaitianHmongHonduranHopiHoumaHungarianIcelanderIndian (Asian)IndonesianInupiatIranianIraqiIrishIroquoisIsraeliItalianJamaicanJapaneseJordanianKenyanKiowaKoreanLaotianLatvianLebaneseLiberianLithuanianLumbeeLuxembourgerMacedonianMalaysianMalteseMarshalleseMenomineeMexicanMexican American IndianMongolianMoroccanNative HawaiianNavajoNepaleseNew ZealanderNicaraguanNigerianNorthern EuropeanNorwegianOkinawanOsageOttawaPaiutePakistaniPalestinianPanamanianParaguayanPennsylvania GermanPeruvianPimaPolishPortuguesePotawatomiPuebloPuerto RicanPuget Sound SalishRomanianRussianSalvadoranSamoanScandinavianScotch-IrishScottishSeminoleSenegaleseSerbianShoshoneSierra LeoneanSiouxSlavicSlovakSloveneSomaliSouth AfricanSouth AmericanSouth American IndianSoviet UnionSpaniardSpanishSpanish AmericanSpanish American IndianSri LankanSubsaharan AfricanSudaneseSwedishSwissSyrianTaiwaneseThaiTlingit-HaidaTohono O'OdhamTonganTrinidadian and TobagonianTsimshianTurkishU.S. Virgin IslanderUgandanUkrainianUruguayanUteVenezuelanVietnameseWelshWest IndianYakamaYaquiYugoslavianYumanYup'ikZimbabwean
Immigration
NonimmigrantsImmigrantsAfghanistanAfricaAlbaniaArgentinaArmeniaAsiaAustraliaAustriaBahamasBangladeshBarbadosBelarusBelgiumBelizeBoliviaBosnia and HerzegovinaBrazilBulgariaBurma/MyanmarCabo VerdeCambodiaCameroonCanadaCaribbeanCentral AmericaChileChinaColombiaCongoCosta RicaCroatiaCubaCzechoslovakiaDenmarkDominicaDominican RepublicEastern AfricaEastern AsiaEastern EuropeEcuadorEgyptEl SalvadorEnglandEritreaEthiopiaEuropeFijiFranceGermanyGhanaGreeceGrenadaGuatemalaGuyanaHaitiHondurasHong KongHungaryIndiaIndonesiaIranIraqIrelandIsraelItalyJamaicaJapanJordanKazakhstanKenyaKoreaKuwaitLaosLatin AmericaLatviaLebanonLiberiaLithuaniaMalaysiaMexicoMicronesiaMiddle AfricaMoldovaMoroccoNepalNetherlandsNicaraguaNigeriaNorth AmericaNorth MacedoniaNorthern AfricaNorthern EuropeNorwayOceaniaPakistanPanamaPeruPhilippinesPolandPortugalRomaniaRussiaSaudi ArabiaScotlandSenegalSerbiaSierra LeoneSingaporeSomaliaSouth AfricaSouth AmericaSouth Central AsiaSouth Eastern AsiaSouthern EuropeSpainSri LankaSt. Vincent and the GrenadinesSudanSwedenSwitzerlandSyriaTaiwanThailandTrinidad and TobagoTurkeyUgandaUkraineUruguayUzbekistanVenezuelaVietnamWest IndiesWestern AfricaWestern AsiaWestern EuropeYemenZaireZimbabweAzores
Select to Compare
Race
Ancestry
AfghanAfricanAlaska NativeAlaskan AthabascanAlbanianAleutAlsatianAmericanApacheArabArapahoArgentineanArmenianAssyrian/Chaldean/SyriacAustralianAustrianBahamianBangladeshiBarbadianBasqueBelgianBelizeanBermudanBhutaneseBlackfeetBolivianBrazilianBritishBritish West IndianBulgarianBurmeseCajunCambodianCanadianCape VerdeanCarpatho RusynCelticCentral AmericanCentral American IndianCherokeeCheyenneChickasawChileanChineseChippewaChoctawColombianColvilleComancheCosta RicanCreeCreekCroatianCrowCubanCypriotCzechCzechoslovakianDanishDelawareDominicanDutchDutch West IndianEastern EuropeanEcuadorianEgyptianEnglishEstonianEthiopianEuropeanFijianFilipinoFinnishFrenchFrench American IndianFrench CanadianGermanGerman RussianGhanaianGreekGuamanian/ChamorroGuatemalanGuyaneseHaitianHmongHonduranHopiHoumaHungarianIcelanderIndian (Asian)IndonesianInupiatIranianIraqiIrishIroquoisIsraeliItalianJamaicanJapaneseJordanianKenyanKiowaKoreanLaotianLatvianLebaneseLiberianLithuanianLumbeeLuxembourgerMacedonianMalaysianMalteseMarshalleseMenomineeMexicanMexican American IndianMongolianMoroccanNative HawaiianNavajoNepaleseNew ZealanderNicaraguanNigerianNorthern EuropeanNorwegianOkinawanOsageOttawaPaiutePakistaniPalestinianPanamanianParaguayanPennsylvania GermanPeruvianPimaPolishPortuguesePotawatomiPuebloPuerto RicanPuget Sound SalishRomanianRussianSalvadoranSamoanScandinavianScotch-IrishScottishSeminoleSenegaleseSerbianShoshoneSierra LeoneanSiouxSlavicSlovakSloveneSomaliSouth AfricanSouth AmericanSouth American IndianSoviet UnionSpaniardSpanishSpanish AmericanSpanish American IndianSri LankanSubsaharan AfricanSudaneseSwedishSwissSyrianTaiwaneseThaiTlingit-HaidaTohono O'OdhamTonganTsimshianTurkishU.S. Virgin IslanderUgandanUkrainianUruguayanUteVenezuelanVietnameseWelshWest IndianYakamaYaquiYugoslavianYumanYup'ikZimbabwean
Immigration
NonimmigrantsImmigrantsAfghanistanAfricaAlbaniaArgentinaArmeniaAsiaAustraliaAustriaBahamasBangladeshBarbadosBelarusBelgiumBelizeBoliviaBosnia and HerzegovinaBrazilBulgariaBurma/MyanmarCabo VerdeCambodiaCameroonCanadaCaribbeanCentral AmericaChileChinaColombiaCongoCosta RicaCroatiaCubaCzechoslovakiaDenmarkDominicaDominican RepublicEastern AfricaEastern AsiaEastern EuropeEcuadorEgyptEl SalvadorEnglandEritreaEthiopiaEuropeFijiFranceGermanyGhanaGreeceGrenadaGuatemalaGuyanaHaitiHondurasHong KongHungaryIndiaIndonesiaIranIraqIrelandIsraelItalyJamaicaJapanJordanKazakhstanKenyaKoreaKuwaitLaosLatin AmericaLatviaLebanonLiberiaLithuaniaMalaysiaMexicoMicronesiaMiddle AfricaMoldovaMoroccoNepalNetherlandsNicaraguaNigeriaNorth AmericaNorth MacedoniaNorthern AfricaNorthern EuropeNorwayOceaniaPakistanPanamaPeruPhilippinesPolandPortugalRomaniaRussiaSaudi ArabiaScotlandSenegalSerbiaSierra LeoneSingaporeSomaliaSouth AfricaSouth AmericaSouth Central AsiaSouth Eastern AsiaSouthern EuropeSpainSri LankaSt. Vincent and the GrenadinesSudanSwedenSwitzerlandSyriaTaiwanThailandTrinidad and TobagoTurkeyUgandaUkraineUruguayUzbekistanVenezuelaVietnamWest IndiesWestern AfricaWestern AsiaWestern EuropeYemenZaireZimbabweAzores
Disability Age Under 5
Income
Poverty
Unemployment
Labor Participation
Family Structure
Vehicle Availability
Education Level
Disability

Trinidadian and Tobagonian Disability Age Under 5
Exceptional

1.1%
DISABILITY | AGE UNDER 5
98.6/ 100
METRIC RATING
71st/ 347
METRIC RANK

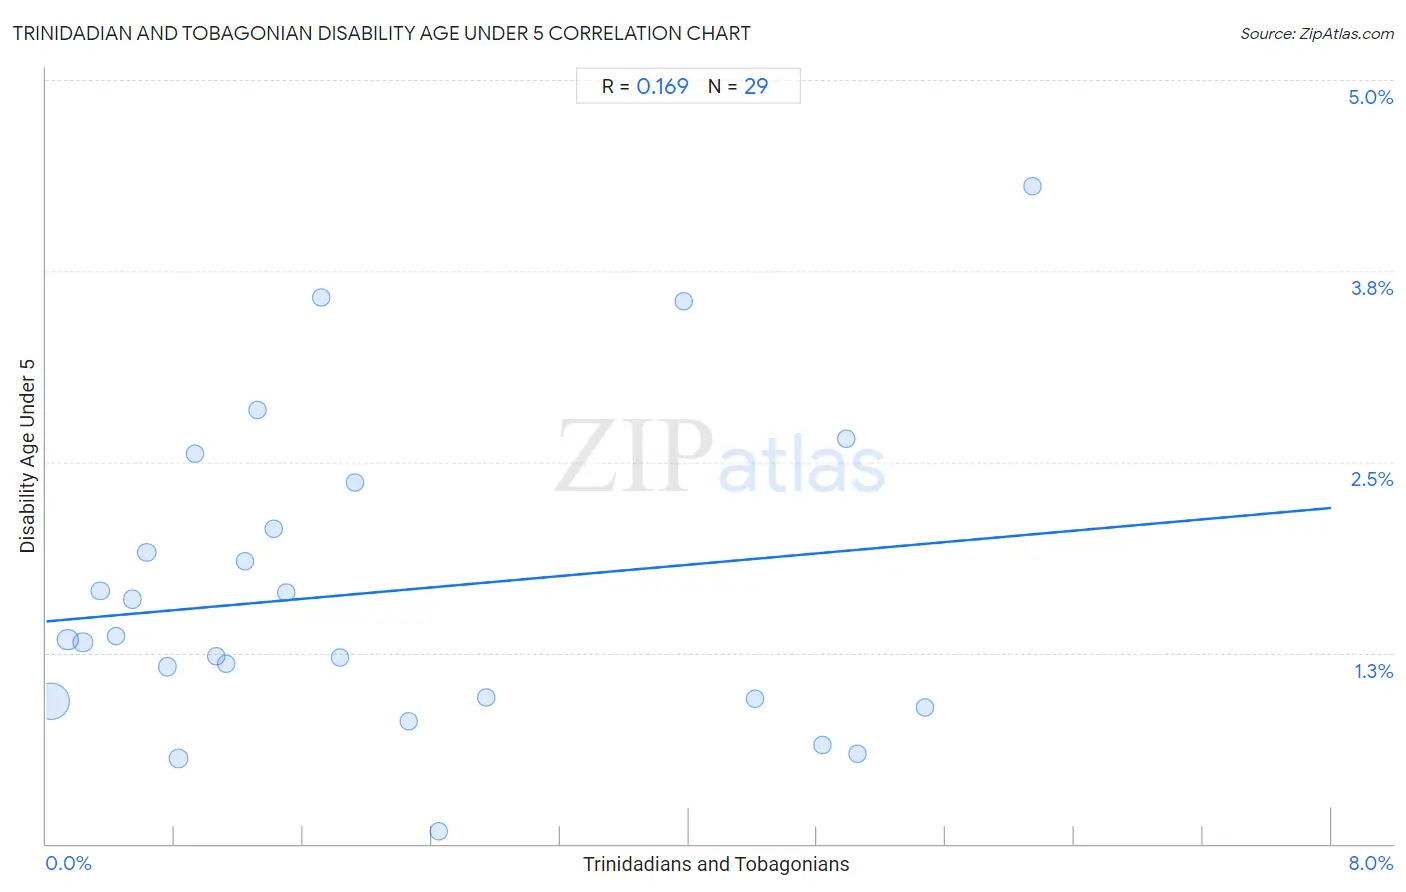
Trinidadian and Tobagonian Disability Age Under 5 Correlation Chart

The statistical analysis conducted on geographies consisting of 140,023,510 people shows a poor positive correlation between the proportion of Trinidadians and Tobagonians and percentage of population with a disability under the age of 5 in the United States with a correlation coefficient (R) of 0.169 and weighted average of 1.1%. On average, for every 1% (one percent) increase in Trinidadians and Tobagonians within a typical geography, there is an increase of 0.093% in percentage of population with a disability under the age of 5.
Trinidadian and Tobagonian Disability Age Under 5
It is essential to understand that the correlation between the percentage of Trinidadians and Tobagonians and percentage of population with a disability under the age of 5 does not imply a direct cause-and-effect relationship. It remains uncertain whether the presence of Trinidadians and Tobagonians influences an upward or downward trend in the level of percentage of population with a disability under the age of 5 within an area, or if Trinidadians and Tobagonians simply ended up residing in those areas with higher or lower levels of percentage of population with a disability under the age of 5 due to other factors.

Demographics Similar to Trinidadians and Tobagonians by Disability Age Under 5

In terms of disability age under 5, the demographic groups most similar to Trinidadians and Tobagonians are Immigrants from Ecuador (1.1%, a difference of 0.060%), Israeli (1.1%, a difference of 0.15%), Burmese (1.1%, a difference of 0.16%), South African (1.1%, a difference of 0.17%), and Immigrants from Belize (1.1%, a difference of 0.21%).
DemographicsRating | RankDisability Age Under 5
Egyptians
98.9
/100
|
#64
Exceptional
1.1%
Immigrants from Korea
98.8
/100
|
#65
Exceptional
1.1%
Immigrants from Indonesia
98.7
/100
|
#66
Exceptional
1.1%
Immigrants from Belize
98.7
/100
|
#67
Exceptional
1.1%
South Africans
98.7
/100
|
#68
Exceptional
1.1%
Israelis
98.7
/100
|
#69
Exceptional
1.1%
Immigrants from Ecuador
98.6
/100
|
#70
Exceptional
1.1%
Trinidadians and Tobagonians
98.6
/100
|
#71
Exceptional
1.1%
Burmese
98.5
/100
|
#72
Exceptional
1.1%
Immigrants from Sri Lanka
98.5
/100
|
#73
Exceptional
1.1%
Jordanians
98.5
/100
|
#74
Exceptional
1.1%
Immigrants from Pakistan
98.4
/100
|
#75
Exceptional
1.1%
Immigrants from Burma/Myanmar
98.2
/100
|
#76
Exceptional
1.1%
Immigrants from Denmark
98.1
/100
|
#77
Exceptional
1.1%
West Indians
98.0
/100
|
#78
Exceptional
1.1%

Trinidadian and Tobagonian Disability Age Under 5 Correlation Summary

MeasurementTrinidadian and Tobagonian DataDisability Age Under 5 Data
Minimum0.034%0.086%
Maximum6.1%4.3%
Range6.1%4.2%
Mean2.1%1.6%
Median1.4%1.3%
Interquartile 25% (IQ1)0.69%0.94%
Interquartile 75% (IQ3)3.4%2.2%
Interquartile Range (IQR)2.7%1.3%
Standard Deviation (Sample)1.8%1.0%
Standard Deviation (Population)1.8%0.98%

Correlation Details

Trinidadian and Tobagonian PercentileSample SizeDisability Age Under 5
[
0.0%
-
0.5%
]
0.034%
95,464,8770.94%
[
0.0%
-
0.5%
]
0.14%
15,833,0131.3%
[
0.0%
-
0.5%
]
0.23%
8,342,1581.3%
[
0.0%
-
0.5%
]
0.34%
3,758,2751.7%
[
0.0%
-
0.5%
]
0.44%
1,813,1561.4%
[
0.5%
-
1.0%
]
0.54%
1,234,0531.6%
[
0.5%
-
1.0%
]
0.63%
1,175,3711.9%
[
0.5%
-
1.0%
]
0.76%
1,257,9531.2%
[
0.5%
-
1.0%
]
0.82%
8,840,2380.56%
[
0.5%
-
1.0%
]
0.92%
308,8192.6%
[
1.0%
-
1.5%
]
1.06%
275,2951.2%
[
1.0%
-
1.5%
]
1.12%
363,0861.2%
[
1.0%
-
1.5%
]
1.23%
218,3281.8%
[
1.0%
-
1.5%
]
1.31%
186,4562.8%
[
1.0%
-
1.5%
]
1.42%
131,3562.1%
[
1.0%
-
1.5%
]
1.50%
67,2721.6%
[
1.5%
-
2.0%
]
1.71%
25,5163.6%
[
1.5%
-
2.0%
]
1.83%
108,1801.2%
[
1.5%
-
2.0%
]
1.92%
63,8482.4%
[
2.0%
-
2.5%
]
2.26%
62,3730.80%
[
2.0%
-
2.5%
]
2.45%
89,9760.086%
[
2.5%
-
3.0%
]
2.74%
19,1640.96%
[
3.5%
-
4.0%
]
3.97%
27,8453.6%
[
4.0%
-
4.5%
]
4.41%
38,8650.95%
[
4.5%
-
5.0%
]
4.83%
100,0820.65%
[
4.5%
-
5.0%
]
4.98%
51,1532.7%
[
5.0%
-
5.5%
]
5.05%
58,4760.59%
[
5.0%
-
5.5%
]
5.47%
78,5060.89%
[
6.0%
-
6.5%
]
6.14%
29,8204.3%