Sri Lankan College, Under 1 year
COMPARE
Sri Lankan
Select to Compare
College, Under 1 year
Sri Lankan College, Under 1 year
65.2%
COLLEGE, UNDER 1 YEAR
41.7/ 100
METRIC RATING
185th/ 347
METRIC RANK
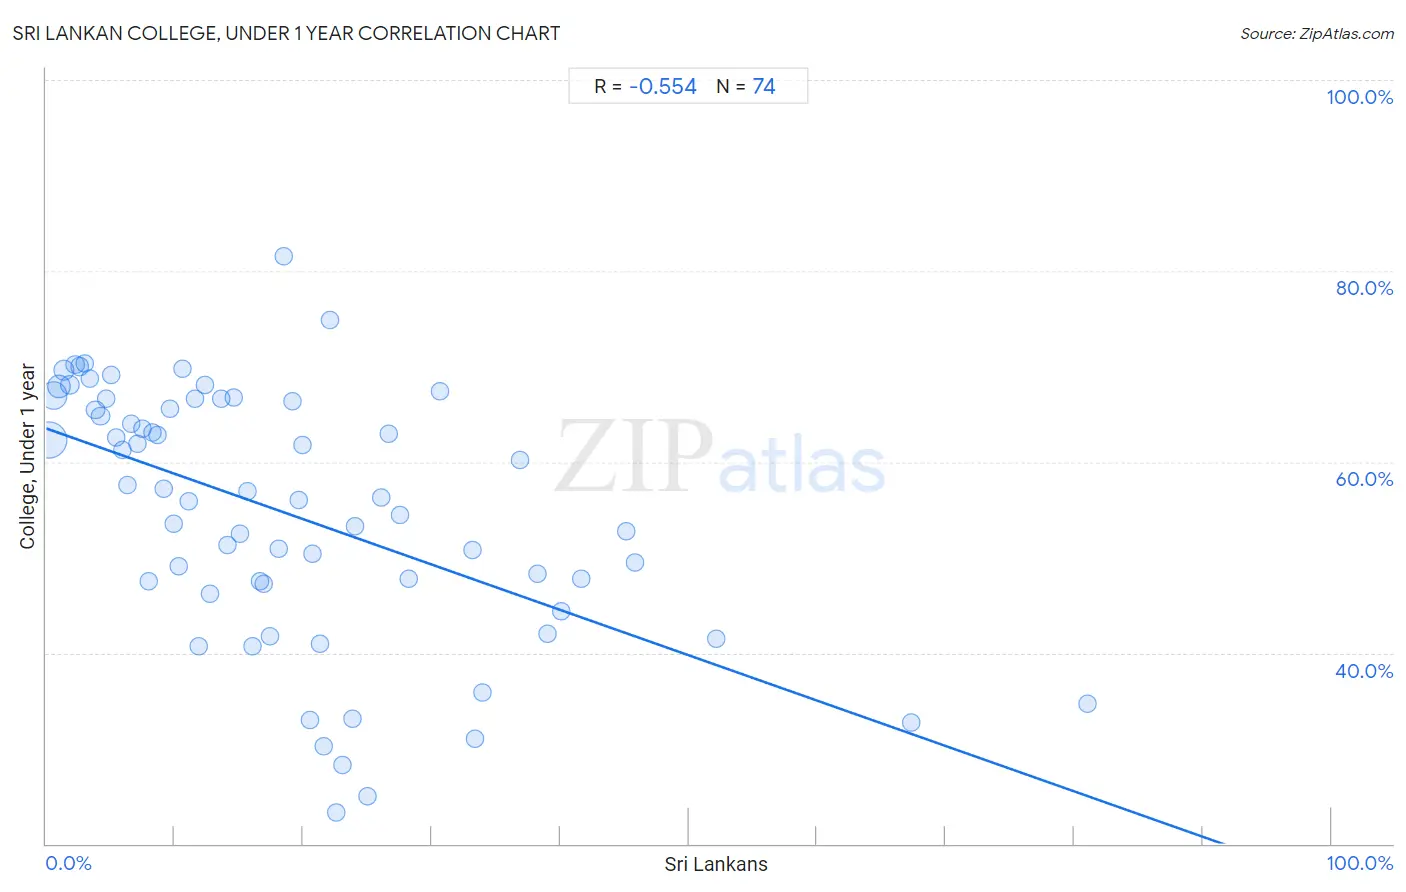
Sri Lankan College, Under 1 year Correlation Chart
The statistical analysis conducted on geographies consisting of 440,590,245 people shows a substantial negative correlation between the proportion of Sri Lankans and percentage of population with at least college, under 1 year education in the United States with a correlation coefficient (R) of -0.554 and weighted average of 65.2%. On average, for every 1% (one percent) increase in Sri Lankans within a typical geography, there is a decrease of 0.48% in percentage of population with at least college, under 1 year education.
It is essential to understand that the correlation between the percentage of Sri Lankans and percentage of population with at least college, under 1 year education does not imply a direct cause-and-effect relationship. It remains uncertain whether the presence of Sri Lankans influences an upward or downward trend in the level of percentage of population with at least college, under 1 year education within an area, or if Sri Lankans simply ended up residing in those areas with higher or lower levels of percentage of population with at least college, under 1 year education due to other factors.
Demographics Similar to Sri Lankans by College, Under 1 year
In terms of college, under 1 year, the demographic groups most similar to Sri Lankans are Bermudan (65.2%, a difference of 0.010%), Immigrants from Poland (65.2%, a difference of 0.040%), Immigrants from Sierra Leone (65.1%, a difference of 0.090%), Immigrants from Africa (65.3%, a difference of 0.13%), and Spaniard (65.3%, a difference of 0.17%).
| Demographics | Rating | Rank | College, Under 1 year |
| German Russians | 48.3 /100 | #178 | Average 65.4% |
| Guamanians/Chamorros | 48.2 /100 | #179 | Average 65.4% |
| Dutch | 46.1 /100 | #180 | Average 65.3% |
| Spaniards | 45.5 /100 | #181 | Average 65.3% |
| Immigrants from Africa | 44.7 /100 | #182 | Average 65.3% |
| Immigrants from Poland | 42.6 /100 | #183 | Average 65.2% |
| Bermudans | 42.0 /100 | #184 | Average 65.2% |
| Sri Lankans | 41.7 /100 | #185 | Average 65.2% |
| Immigrants from Sierra Leone | 39.7 /100 | #186 | Fair 65.1% |
| Immigrants from Southern Europe | 34.3 /100 | #187 | Fair 64.9% |
| Immigrants from Albania | 32.0 /100 | #188 | Fair 64.9% |
| Spanish | 31.6 /100 | #189 | Fair 64.9% |
| Immigrants from Philippines | 30.1 /100 | #190 | Fair 64.8% |
| Immigrants from Armenia | 28.1 /100 | #191 | Fair 64.7% |
| Immigrants from Thailand | 27.0 /100 | #192 | Fair 64.7% |
Sri Lankan College, Under 1 year Correlation Summary
| Measurement | Sri Lankan Data | College, Under 1 year Data |
| Minimum | 0.18% | 23.3% |
| Maximum | 81.0% | 81.5% |
| Range | 80.9% | 58.3% |
| Mean | 18.8% | 54.6% |
| Median | 15.8% | 56.1% |
| Interquartile 25% (IQ1) | 7.5% | 47.3% |
| Interquartile 75% (IQ3) | 25.0% | 66.4% |
| Interquartile Range (IQR) | 17.5% | 19.1% |
| Standard Deviation (Sample) | 15.5% | 13.3% |
| Standard Deviation (Population) | 15.4% | 13.2% |
Correlation Details
| Sri Lankan Percentile | Sample Size | College, Under 1 year |
[ 0.0% - 0.5% ] 0.18% | 206,953,152 | 62.3% |
[ 0.5% - 1.0% ] 0.57% | 98,847,761 | 67.0% |
[ 0.5% - 1.0% ] 0.98% | 50,827,453 | 67.9% |
[ 1.0% - 1.5% ] 1.40% | 23,105,989 | 69.6% |
[ 1.5% - 2.0% ] 1.82% | 16,924,282 | 68.1% |
[ 2.0% - 2.5% ] 2.23% | 9,916,328 | 70.2% |
[ 2.5% - 3.0% ] 2.61% | 7,294,945 | 70.0% |
[ 2.5% - 3.0% ] 2.99% | 6,041,047 | 70.3% |
[ 3.0% - 3.5% ] 3.42% | 3,203,960 | 68.7% |
[ 3.5% - 4.0% ] 3.83% | 2,984,753 | 65.5% |
[ 4.0% - 4.5% ] 4.23% | 2,039,078 | 64.8% |
[ 4.5% - 5.0% ] 4.64% | 1,466,541 | 66.6% |
[ 5.0% - 5.5% ] 5.06% | 1,666,205 | 69.1% |
[ 5.0% - 5.5% ] 5.45% | 550,019 | 62.6% |
[ 5.5% - 6.0% ] 5.93% | 1,544,394 | 61.2% |
[ 6.0% - 6.5% ] 6.32% | 440,564 | 57.6% |
[ 6.5% - 7.0% ] 6.62% | 509,300 | 63.9% |
[ 7.0% - 7.5% ] 7.09% | 470,749 | 61.9% |
[ 7.0% - 7.5% ] 7.49% | 349,263 | 63.4% |
[ 7.5% - 8.0% ] 7.98% | 470,299 | 47.5% |
[ 8.0% - 8.5% ] 8.26% | 327,908 | 63.1% |
[ 8.5% - 9.0% ] 8.64% | 261,684 | 62.9% |
[ 9.0% - 9.5% ] 9.13% | 463,535 | 57.2% |
[ 9.5% - 10.0% ] 9.66% | 35,874 | 65.6% |
[ 9.5% - 10.0% ] 9.89% | 162,646 | 53.5% |
[ 10.0% - 10.5% ] 10.28% | 189,042 | 49.0% |
[ 10.5% - 11.0% ] 10.59% | 138,156 | 69.8% |
[ 11.0% - 11.5% ] 11.09% | 252,638 | 55.9% |
[ 11.5% - 12.0% ] 11.62% | 170,711 | 66.7% |
[ 11.5% - 12.0% ] 11.89% | 3,710 | 40.7% |
[ 12.0% - 12.5% ] 12.33% | 1,095,631 | 68.1% |
[ 12.5% - 13.0% ] 12.78% | 114,413 | 46.2% |
[ 13.5% - 14.0% ] 13.63% | 243,185 | 66.6% |
[ 14.0% - 14.5% ] 14.12% | 221,988 | 51.3% |
[ 14.5% - 15.0% ] 14.60% | 678 | 66.8% |
[ 15.0% - 15.5% ] 15.09% | 13,719 | 52.5% |
[ 15.5% - 16.0% ] 15.65% | 27,827 | 56.9% |
[ 16.0% - 16.5% ] 16.03% | 62,929 | 40.6% |
[ 16.5% - 17.0% ] 16.59% | 211 | 47.5% |
[ 16.5% - 17.0% ] 16.88% | 30,260 | 47.3% |
[ 17.0% - 17.5% ] 17.44% | 51,043 | 41.7% |
[ 18.0% - 18.5% ] 18.08% | 78,918 | 50.9% |
[ 18.0% - 18.5% ] 18.48% | 92 | 81.5% |
[ 19.0% - 19.5% ] 19.13% | 2,661 | 66.4% |
[ 19.5% - 20.0% ] 19.68% | 59,851 | 56.0% |
[ 19.5% - 20.0% ] 19.96% | 96,079 | 61.8% |
[ 20.0% - 20.5% ] 20.49% | 893 | 32.9% |
[ 20.5% - 21.0% ] 20.69% | 7,786 | 50.4% |
[ 21.0% - 21.5% ] 21.31% | 52,555 | 41.0% |
[ 21.5% - 22.0% ] 21.59% | 1,575 | 30.2% |
[ 22.0% - 22.5% ] 22.07% | 580 | 74.8% |
[ 22.5% - 23.0% ] 22.54% | 346 | 23.3% |
[ 23.0% - 23.5% ] 23.05% | 859 | 28.3% |
[ 23.5% - 24.0% ] 23.79% | 1,753 | 33.1% |
[ 24.0% - 24.5% ] 24.04% | 857 | 53.3% |
[ 25.0% - 25.5% ] 25.00% | 4 | 25.0% |
[ 26.0% - 26.5% ] 26.04% | 9,832 | 56.3% |
[ 26.5% - 27.0% ] 26.64% | 184,010 | 62.9% |
[ 27.5% - 28.0% ] 27.51% | 53,826 | 54.4% |
[ 28.0% - 28.5% ] 28.22% | 6,563 | 47.8% |
[ 30.5% - 31.0% ] 30.64% | 45,688 | 67.4% |
[ 33.0% - 33.5% ] 33.20% | 171,637 | 50.8% |
[ 33.0% - 33.5% ] 33.39% | 593 | 31.0% |
[ 33.5% - 34.0% ] 33.92% | 401 | 35.8% |
[ 36.5% - 37.0% ] 36.91% | 36,657 | 60.2% |
[ 38.0% - 38.5% ] 38.21% | 34,227 | 48.3% |
[ 39.0% - 39.5% ] 39.02% | 47,697 | 41.9% |
[ 40.0% - 40.5% ] 40.07% | 16,072 | 44.4% |
[ 41.5% - 42.0% ] 41.67% | 120 | 47.7% |
[ 45.0% - 45.5% ] 45.14% | 181,268 | 52.8% |
[ 45.5% - 46.0% ] 45.82% | 22,622 | 49.4% |
[ 52.0% - 52.5% ] 52.13% | 188 | 41.5% |
[ 67.0% - 67.5% ] 67.35% | 49 | 32.7% |
[ 81.0% - 81.5% ] 81.03% | 116 | 34.7% |