Sri Lankan 2 or more Vehicles in Household
COMPARE
Sri Lankan
Select to Compare
2 or more Vehicles in Household
Sri Lankan 2 or more Vehicles in Household
61.0%
2+ VEHICLES AVAILABLE
100.0/ 100
METRIC RATING
20th/ 347
METRIC RANK
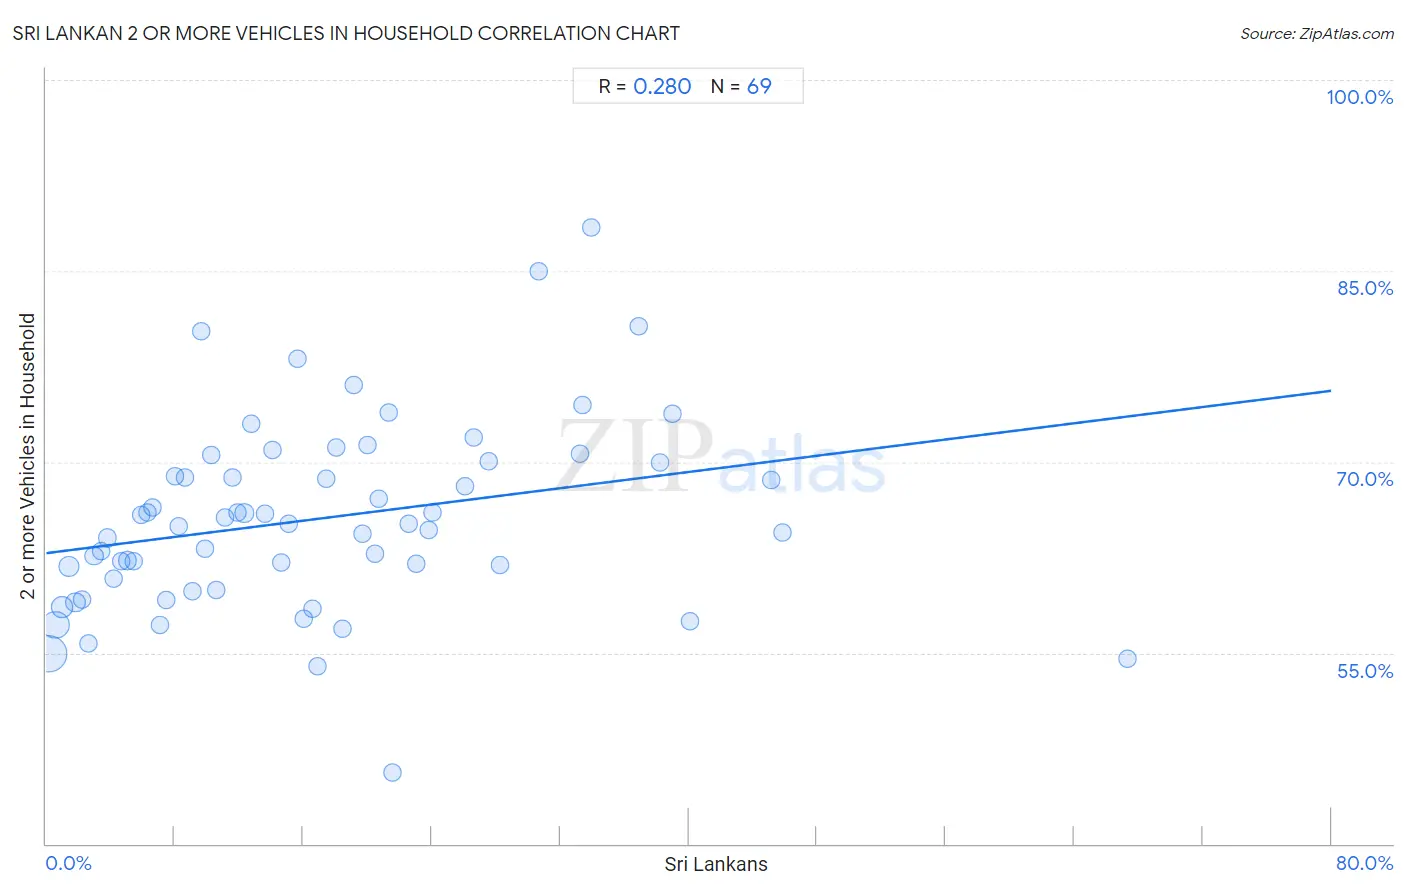
Sri Lankan 2 or more Vehicles in Household Correlation Chart
The statistical analysis conducted on geographies consisting of 440,160,009 people shows a weak positive correlation between the proportion of Sri Lankans and percentage of households with 2 or more vehicles available in the United States with a correlation coefficient (R) of 0.280 and weighted average of 61.0%. On average, for every 1% (one percent) increase in Sri Lankans within a typical geography, there is an increase of 0.16% in percentage of households with 2 or more vehicles available.
It is essential to understand that the correlation between the percentage of Sri Lankans and percentage of households with 2 or more vehicles available does not imply a direct cause-and-effect relationship. It remains uncertain whether the presence of Sri Lankans influences an upward or downward trend in the level of percentage of households with 2 or more vehicles available within an area, or if Sri Lankans simply ended up residing in those areas with higher or lower levels of percentage of households with 2 or more vehicles available due to other factors.
Demographics Similar to Sri Lankans by 2 or more Vehicles in Household
In terms of 2 or more vehicles in household, the demographic groups most similar to Sri Lankans are Korean (61.0%, a difference of 0.040%), Swiss (61.0%, a difference of 0.080%), Scotch-Irish (60.9%, a difference of 0.12%), Immigrants from Vietnam (60.9%, a difference of 0.16%), and White/Caucasian (60.8%, a difference of 0.31%).
| Demographics | Rating | Rank | 2 or more Vehicles in Household |
| Samoans | 100.0 /100 | #13 | Exceptional 61.5% |
| Czechs | 100.0 /100 | #14 | Exceptional 61.5% |
| Nepalese | 100.0 /100 | #15 | Exceptional 61.4% |
| Native Hawaiians | 100.0 /100 | #16 | Exceptional 61.4% |
| Basques | 100.0 /100 | #17 | Exceptional 61.4% |
| Europeans | 100.0 /100 | #18 | Exceptional 61.4% |
| Scottish | 100.0 /100 | #19 | Exceptional 61.2% |
| Sri Lankans | 100.0 /100 | #20 | Exceptional 61.0% |
| Koreans | 100.0 /100 | #21 | Exceptional 61.0% |
| Swiss | 100.0 /100 | #22 | Exceptional 61.0% |
| Scotch-Irish | 100.0 /100 | #23 | Exceptional 60.9% |
| Immigrants from Vietnam | 100.0 /100 | #24 | Exceptional 60.9% |
| Whites/Caucasians | 100.0 /100 | #25 | Exceptional 60.8% |
| Welsh | 100.0 /100 | #26 | Exceptional 60.8% |
| Assyrians/Chaldeans/Syriacs | 100.0 /100 | #27 | Exceptional 60.5% |
Sri Lankan 2 or more Vehicles in Household Correlation Summary
| Measurement | Sri Lankan Data | 2 or more Vehicles in Household Data |
| Minimum | 0.18% | 45.6% |
| Maximum | 67.3% | 88.5% |
| Range | 67.2% | 42.8% |
| Mean | 17.0% | 65.5% |
| Median | 14.6% | 65.1% |
| Interquartile 25% (IQ1) | 6.9% | 60.4% |
| Interquartile 75% (IQ3) | 23.4% | 70.0% |
| Interquartile Range (IQR) | 16.6% | 9.6% |
| Standard Deviation (Sample) | 13.1% | 7.5% |
| Standard Deviation (Population) | 13.0% | 7.4% |
Correlation Details
| Sri Lankan Percentile | Sample Size | 2 or more Vehicles in Household |
[ 0.0% - 0.5% ] 0.18% | 206,847,395 | 54.9% |
[ 0.5% - 1.0% ] 0.57% | 98,740,231 | 57.2% |
[ 0.5% - 1.0% ] 0.98% | 50,741,696 | 58.6% |
[ 1.0% - 1.5% ] 1.40% | 23,068,611 | 61.8% |
[ 1.5% - 2.0% ] 1.82% | 16,891,662 | 58.9% |
[ 2.0% - 2.5% ] 2.23% | 9,889,506 | 59.2% |
[ 2.5% - 3.0% ] 2.61% | 7,281,749 | 55.8% |
[ 2.5% - 3.0% ] 2.99% | 6,034,539 | 62.6% |
[ 3.0% - 3.5% ] 3.42% | 3,203,960 | 63.0% |
[ 3.5% - 4.0% ] 3.83% | 2,984,753 | 64.0% |
[ 4.0% - 4.5% ] 4.23% | 2,038,466 | 60.8% |
[ 4.5% - 5.0% ] 4.64% | 1,462,231 | 62.2% |
[ 5.0% - 5.5% ] 5.06% | 1,663,854 | 62.2% |
[ 5.0% - 5.5% ] 5.45% | 547,975 | 62.2% |
[ 5.5% - 6.0% ] 5.93% | 1,543,848 | 65.9% |
[ 6.0% - 6.5% ] 6.32% | 440,564 | 66.0% |
[ 6.5% - 7.0% ] 6.62% | 509,300 | 66.4% |
[ 7.0% - 7.5% ] 7.09% | 470,294 | 57.2% |
[ 7.0% - 7.5% ] 7.49% | 349,263 | 59.2% |
[ 7.5% - 8.0% ] 7.98% | 467,585 | 68.9% |
[ 8.0% - 8.5% ] 8.26% | 327,736 | 64.9% |
[ 8.5% - 9.0% ] 8.64% | 261,684 | 68.8% |
[ 9.0% - 9.5% ] 9.13% | 463,535 | 59.8% |
[ 9.5% - 10.0% ] 9.66% | 35,664 | 80.3% |
[ 9.5% - 10.0% ] 9.89% | 162,646 | 63.2% |
[ 10.0% - 10.5% ] 10.28% | 189,042 | 70.5% |
[ 10.5% - 11.0% ] 10.59% | 138,156 | 60.0% |
[ 11.0% - 11.5% ] 11.09% | 252,540 | 65.6% |
[ 11.5% - 12.0% ] 11.62% | 170,711 | 68.7% |
[ 11.5% - 12.0% ] 11.89% | 3,710 | 66.1% |
[ 12.0% - 12.5% ] 12.33% | 1,095,631 | 66.0% |
[ 12.5% - 13.0% ] 12.78% | 114,413 | 73.0% |
[ 13.5% - 14.0% ] 13.63% | 243,185 | 65.9% |
[ 14.0% - 14.5% ] 14.12% | 221,988 | 70.9% |
[ 14.5% - 15.0% ] 14.60% | 678 | 62.1% |
[ 15.0% - 15.5% ] 15.09% | 13,719 | 65.1% |
[ 15.5% - 16.0% ] 15.65% | 27,827 | 78.1% |
[ 16.0% - 16.5% ] 16.03% | 62,929 | 57.7% |
[ 16.5% - 17.0% ] 16.59% | 211 | 58.5% |
[ 16.5% - 17.0% ] 16.88% | 30,260 | 54.0% |
[ 17.0% - 17.5% ] 17.44% | 51,043 | 68.7% |
[ 18.0% - 18.5% ] 18.08% | 78,918 | 71.2% |
[ 18.0% - 18.5% ] 18.48% | 92 | 56.9% |
[ 19.0% - 19.5% ] 19.13% | 2,661 | 76.1% |
[ 19.5% - 20.0% ] 19.68% | 59,851 | 64.4% |
[ 19.5% - 20.0% ] 19.96% | 96,079 | 71.4% |
[ 20.0% - 20.5% ] 20.49% | 893 | 62.8% |
[ 20.5% - 21.0% ] 20.69% | 7,786 | 67.1% |
[ 21.0% - 21.5% ] 21.31% | 52,555 | 73.9% |
[ 21.5% - 22.0% ] 21.59% | 1,575 | 45.6% |
[ 22.5% - 23.0% ] 22.54% | 346 | 65.1% |
[ 23.0% - 23.5% ] 23.05% | 859 | 62.0% |
[ 23.5% - 24.0% ] 23.79% | 1,753 | 64.7% |
[ 24.0% - 24.5% ] 24.04% | 857 | 66.0% |
[ 26.0% - 26.5% ] 26.04% | 9,832 | 68.1% |
[ 26.5% - 27.0% ] 26.64% | 184,010 | 71.9% |
[ 27.5% - 28.0% ] 27.51% | 53,826 | 70.0% |
[ 28.0% - 28.5% ] 28.22% | 6,563 | 61.9% |
[ 30.5% - 31.0% ] 30.64% | 45,688 | 85.0% |
[ 33.0% - 33.5% ] 33.20% | 171,637 | 70.6% |
[ 33.0% - 33.5% ] 33.39% | 593 | 74.4% |
[ 33.5% - 34.0% ] 33.92% | 401 | 88.5% |
[ 36.5% - 37.0% ] 36.91% | 36,657 | 80.6% |
[ 38.0% - 38.5% ] 38.21% | 34,227 | 70.0% |
[ 39.0% - 39.5% ] 39.02% | 47,549 | 73.8% |
[ 40.0% - 40.5% ] 40.07% | 16,072 | 57.5% |
[ 45.0% - 45.5% ] 45.14% | 181,268 | 68.6% |
[ 45.5% - 46.0% ] 45.82% | 22,622 | 64.5% |
[ 67.0% - 67.5% ] 67.35% | 49 | 54.5% |