Sioux College, Under 1 year
COMPARE
Sioux
Select to Compare
College, Under 1 year
Sioux College, Under 1 year
59.4%
COLLEGE, UNDER 1 YEAR
0.0/ 100
METRIC RATING
287th/ 347
METRIC RANK
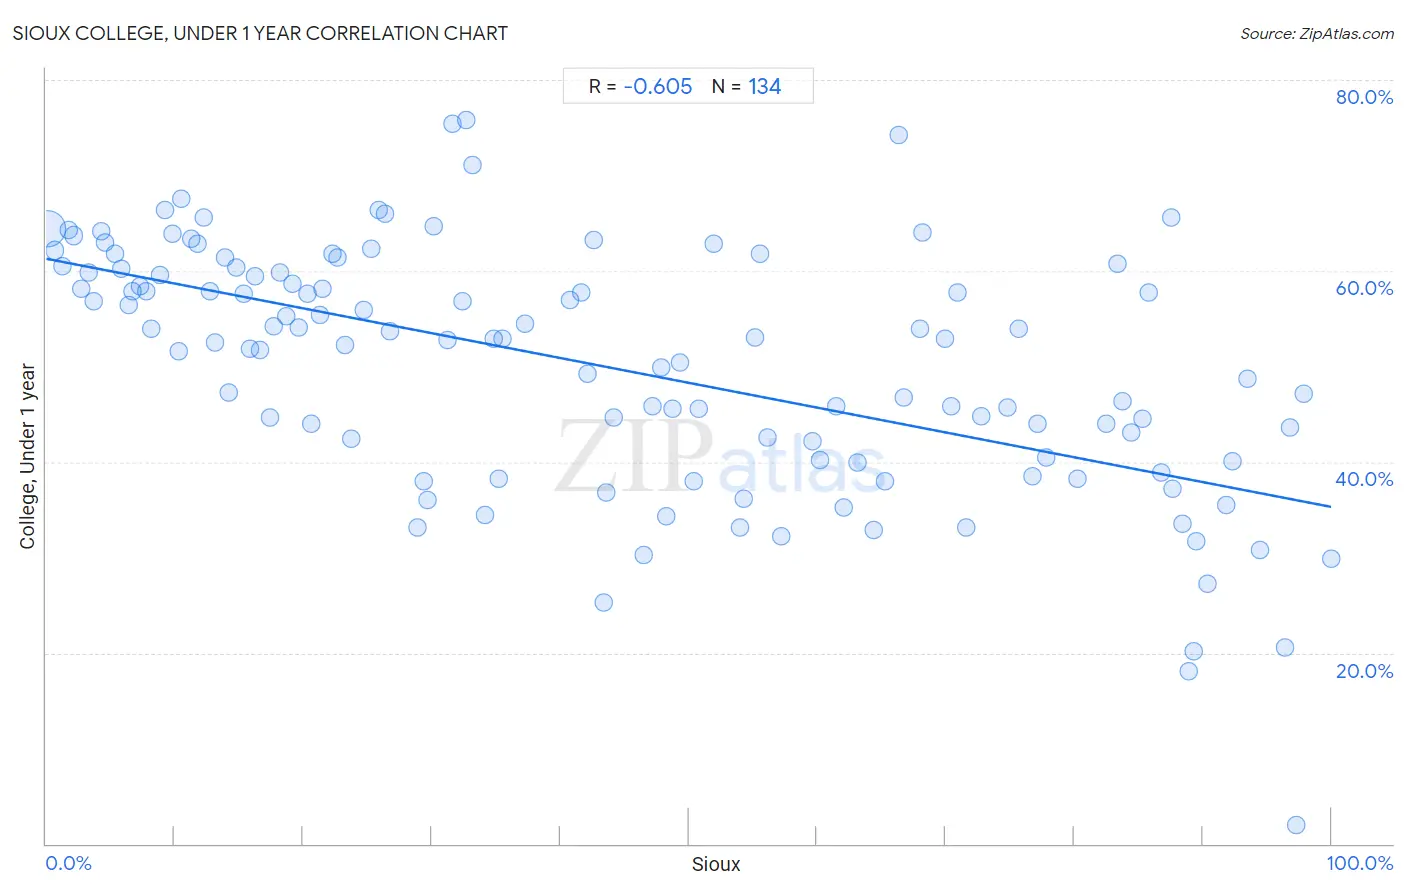
Sioux College, Under 1 year Correlation Chart
The statistical analysis conducted on geographies consisting of 234,200,116 people shows a significant negative correlation between the proportion of Sioux and percentage of population with at least college, under 1 year education in the United States with a correlation coefficient (R) of -0.605 and weighted average of 59.4%. On average, for every 1% (one percent) increase in Sioux within a typical geography, there is a decrease of 0.26% in percentage of population with at least college, under 1 year education.
It is essential to understand that the correlation between the percentage of Sioux and percentage of population with at least college, under 1 year education does not imply a direct cause-and-effect relationship. It remains uncertain whether the presence of Sioux influences an upward or downward trend in the level of percentage of population with at least college, under 1 year education within an area, or if Sioux simply ended up residing in those areas with higher or lower levels of percentage of population with at least college, under 1 year education due to other factors.
Demographics Similar to Sioux by College, Under 1 year
In terms of college, under 1 year, the demographic groups most similar to Sioux are Black/African American (59.4%, a difference of 0.10%), British West Indian (59.5%, a difference of 0.17%), Choctaw (59.3%, a difference of 0.17%), Ecuadorian (59.3%, a difference of 0.21%), and Creek (59.3%, a difference of 0.29%).
| Demographics | Rating | Rank | College, Under 1 year |
| Crow | 0.1 /100 | #280 | Tragic 60.2% |
| Cherokee | 0.1 /100 | #281 | Tragic 60.1% |
| Belizeans | 0.1 /100 | #282 | Tragic 60.1% |
| Immigrants from Jamaica | 0.0 /100 | #283 | Tragic 59.7% |
| Immigrants from St. Vincent and the Grenadines | 0.0 /100 | #284 | Tragic 59.6% |
| Paiute | 0.0 /100 | #285 | Tragic 59.6% |
| British West Indians | 0.0 /100 | #286 | Tragic 59.5% |
| Sioux | 0.0 /100 | #287 | Tragic 59.4% |
| Blacks/African Americans | 0.0 /100 | #288 | Tragic 59.4% |
| Choctaw | 0.0 /100 | #289 | Tragic 59.3% |
| Ecuadorians | 0.0 /100 | #290 | Tragic 59.3% |
| Creek | 0.0 /100 | #291 | Tragic 59.3% |
| Nicaraguans | 0.0 /100 | #292 | Tragic 59.2% |
| Seminole | 0.0 /100 | #293 | Tragic 59.1% |
| Immigrants from Belize | 0.0 /100 | #294 | Tragic 59.1% |
Sioux College, Under 1 year Correlation Summary
| Measurement | Sioux Data | College, Under 1 year Data |
| Minimum | 0.069% | 2.0% |
| Maximum | 100.0% | 75.8% |
| Range | 99.9% | 73.8% |
| Mean | 43.5% | 50.0% |
| Median | 39.0% | 52.8% |
| Interquartile 25% (IQ1) | 16.6% | 40.2% |
| Interquartile 75% (IQ3) | 69.9% | 59.9% |
| Interquartile Range (IQR) | 53.3% | 19.7% |
| Standard Deviation (Sample) | 30.1% | 12.9% |
| Standard Deviation (Population) | 30.0% | 12.9% |
Correlation Details
| Sioux Percentile | Sample Size | College, Under 1 year |
[ 0.0% - 0.5% ] 0.069% | 226,412,651 | 64.4% |
[ 0.5% - 1.0% ] 0.68% | 4,538,209 | 62.1% |
[ 1.0% - 1.5% ] 1.23% | 1,039,025 | 60.5% |
[ 1.5% - 2.0% ] 1.71% | 477,992 | 64.3% |
[ 2.0% - 2.5% ] 2.18% | 606,748 | 63.7% |
[ 2.5% - 3.0% ] 2.73% | 180,069 | 58.1% |
[ 3.0% - 3.5% ] 3.27% | 162,899 | 59.8% |
[ 3.5% - 4.0% ] 3.72% | 81,140 | 56.8% |
[ 4.0% - 4.5% ] 4.29% | 98,814 | 64.2% |
[ 4.5% - 5.0% ] 4.59% | 47,700 | 63.0% |
[ 5.0% - 5.5% ] 5.30% | 24,736 | 61.8% |
[ 5.5% - 6.0% ] 5.81% | 21,661 | 60.2% |
[ 6.0% - 6.5% ] 6.38% | 43,211 | 56.5% |
[ 6.5% - 7.0% ] 6.74% | 34,024 | 57.8% |
[ 7.0% - 7.5% ] 7.29% | 6,337 | 58.4% |
[ 7.5% - 8.0% ] 7.79% | 4,427 | 57.9% |
[ 8.0% - 8.5% ] 8.22% | 4,283 | 54.0% |
[ 8.5% - 9.0% ] 8.87% | 21,192 | 59.5% |
[ 9.0% - 9.5% ] 9.20% | 12,809 | 66.3% |
[ 9.5% - 10.0% ] 9.83% | 41,462 | 63.9% |
[ 10.0% - 10.5% ] 10.26% | 3,420 | 51.5% |
[ 10.5% - 11.0% ] 10.52% | 75,762 | 67.5% |
[ 11.0% - 11.5% ] 11.30% | 27,612 | 63.4% |
[ 11.5% - 12.0% ] 11.74% | 2,939 | 62.8% |
[ 12.0% - 12.5% ] 12.23% | 7,301 | 65.5% |
[ 12.5% - 13.0% ] 12.75% | 11,996 | 57.9% |
[ 13.0% - 13.5% ] 13.11% | 1,205 | 52.4% |
[ 13.5% - 14.0% ] 13.89% | 3,601 | 61.4% |
[ 14.0% - 14.5% ] 14.16% | 932 | 47.3% |
[ 14.5% - 15.0% ] 14.79% | 47,190 | 60.4% |
[ 15.0% - 15.5% ] 15.38% | 5,721 | 57.6% |
[ 15.5% - 16.0% ] 15.81% | 7,679 | 51.8% |
[ 16.0% - 16.5% ] 16.24% | 862 | 59.5% |
[ 16.5% - 17.0% ] 16.61% | 313 | 51.7% |
[ 17.0% - 17.5% ] 17.42% | 6,057 | 44.7% |
[ 17.5% - 18.0% ] 17.75% | 1,014 | 54.1% |
[ 18.0% - 18.5% ] 18.15% | 3,702 | 59.9% |
[ 18.5% - 19.0% ] 18.71% | 433 | 55.3% |
[ 19.0% - 19.5% ] 19.13% | 873 | 58.6% |
[ 19.5% - 20.0% ] 19.62% | 4,199 | 54.1% |
[ 20.0% - 20.5% ] 20.30% | 739 | 57.6% |
[ 20.5% - 21.0% ] 20.64% | 5,529 | 44.0% |
[ 21.0% - 21.5% ] 21.27% | 1,763 | 55.4% |
[ 21.5% - 22.0% ] 21.54% | 65 | 58.1% |
[ 22.0% - 22.5% ] 22.25% | 3,812 | 61.8% |
[ 22.5% - 23.0% ] 22.69% | 1,441 | 61.4% |
[ 23.0% - 23.5% ] 23.22% | 715 | 52.3% |
[ 23.5% - 24.0% ] 23.71% | 97 | 42.4% |
[ 24.5% - 25.0% ] 24.74% | 5,437 | 55.9% |
[ 25.0% - 25.5% ] 25.31% | 976 | 62.3% |
[ 25.5% - 26.0% ] 25.87% | 688 | 66.4% |
[ 26.0% - 26.5% ] 26.37% | 1,547 | 66.0% |
[ 26.5% - 27.0% ] 26.74% | 2,315 | 53.7% |
[ 28.5% - 29.0% ] 28.94% | 1,479 | 33.2% |
[ 29.0% - 29.5% ] 29.42% | 503 | 38.0% |
[ 29.5% - 30.0% ] 29.71% | 414 | 35.9% |
[ 30.0% - 30.5% ] 30.15% | 534 | 64.7% |
[ 31.0% - 31.5% ] 31.20% | 484 | 52.8% |
[ 31.5% - 32.0% ] 31.58% | 95 | 75.4% |
[ 32.0% - 32.5% ] 32.35% | 68 | 56.8% |
[ 32.5% - 33.0% ] 32.73% | 440 | 75.8% |
[ 33.0% - 33.5% ] 33.19% | 229 | 71.1% |
[ 34.0% - 34.5% ] 34.17% | 1,235 | 34.4% |
[ 34.5% - 35.0% ] 34.85% | 858 | 52.9% |
[ 35.0% - 35.5% ] 35.20% | 125 | 38.3% |
[ 35.5% - 36.0% ] 35.54% | 1,210 | 52.8% |
[ 37.0% - 37.5% ] 37.25% | 153 | 54.5% |
[ 40.5% - 41.0% ] 40.74% | 842 | 57.0% |
[ 41.5% - 42.0% ] 41.63% | 627 | 57.8% |
[ 42.0% - 42.5% ] 42.16% | 1,155 | 49.2% |
[ 42.5% - 43.0% ] 42.65% | 272 | 63.2% |
[ 43.0% - 43.5% ] 43.40% | 106 | 25.3% |
[ 43.5% - 44.0% ] 43.61% | 876 | 36.8% |
[ 44.0% - 44.5% ] 44.17% | 1,621 | 44.7% |
[ 46.5% - 47.0% ] 46.50% | 286 | 30.2% |
[ 47.0% - 47.5% ] 47.15% | 2,195 | 45.9% |
[ 47.5% - 48.0% ] 47.83% | 3,410 | 49.9% |
[ 48.0% - 48.5% ] 48.25% | 228 | 34.3% |
[ 48.5% - 49.0% ] 48.75% | 681 | 45.6% |
[ 49.0% - 49.5% ] 49.30% | 3,509 | 50.4% |
[ 50.0% - 50.5% ] 50.36% | 2,921 | 38.0% |
[ 50.5% - 51.0% ] 50.74% | 1,346 | 45.5% |
[ 51.5% - 52.0% ] 51.90% | 395 | 62.8% |
[ 53.5% - 54.0% ] 53.99% | 1,504 | 33.2% |
[ 54.0% - 54.5% ] 54.24% | 59 | 36.2% |
[ 55.0% - 55.5% ] 55.13% | 5,389 | 53.0% |
[ 55.5% - 56.0% ] 55.51% | 236 | 61.8% |
[ 56.0% - 56.5% ] 56.14% | 6,596 | 42.6% |
[ 57.0% - 57.5% ] 57.21% | 3,905 | 32.2% |
[ 59.5% - 60.0% ] 59.58% | 574 | 42.1% |
[ 60.0% - 60.5% ] 60.20% | 912 | 40.2% |
[ 61.0% - 61.5% ] 61.48% | 283 | 45.8% |
[ 62.0% - 62.5% ] 62.10% | 926 | 35.3% |
[ 63.0% - 63.5% ] 63.12% | 526 | 39.9% |
[ 64.0% - 64.5% ] 64.38% | 146 | 32.9% |
[ 65.0% - 65.5% ] 65.24% | 1,168 | 38.0% |
[ 66.0% - 66.5% ] 66.30% | 362 | 74.2% |
[ 66.5% - 67.0% ] 66.75% | 2,505 | 46.8% |
[ 67.5% - 68.0% ] 67.99% | 2,009 | 53.9% |
[ 68.0% - 68.5% ] 68.23% | 3,516 | 64.1% |
[ 69.5% - 70.0% ] 69.90% | 1,256 | 53.0% |
[ 70.0% - 70.5% ] 70.42% | 896 | 45.8% |
[ 70.5% - 71.0% ] 70.93% | 626 | 57.8% |
[ 71.5% - 72.0% ] 71.62% | 229 | 33.1% |
[ 72.5% - 73.0% ] 72.72% | 766 | 44.8% |
[ 74.5% - 75.0% ] 74.78% | 1,812 | 45.7% |
[ 75.5% - 76.0% ] 75.64% | 2,274 | 54.0% |
[ 76.5% - 77.0% ] 76.79% | 280 | 38.5% |
[ 77.0% - 77.5% ] 77.10% | 262 | 44.0% |
[ 77.5% - 78.0% ] 77.82% | 586 | 40.4% |
[ 80.0% - 80.5% ] 80.26% | 233 | 38.3% |
[ 82.0% - 82.5% ] 82.47% | 3,629 | 44.0% |
[ 83.0% - 83.5% ] 83.33% | 144 | 60.7% |
[ 83.5% - 84.0% ] 83.79% | 7,613 | 46.4% |
[ 84.0% - 84.5% ] 84.39% | 410 | 43.1% |
[ 85.0% - 85.5% ] 85.30% | 2,572 | 44.6% |
[ 85.5% - 86.0% ] 85.75% | 2,204 | 57.8% |
[ 86.5% - 87.0% ] 86.77% | 3,484 | 38.9% |
[ 87.0% - 87.5% ] 87.50% | 176 | 65.5% |
[ 87.5% - 88.0% ] 87.67% | 681 | 37.2% |
[ 88.0% - 88.5% ] 88.38% | 990 | 33.6% |
[ 88.5% - 89.0% ] 88.92% | 343 | 18.1% |
[ 89.0% - 89.5% ] 89.30% | 355 | 20.1% |
[ 89.5% - 90.0% ] 89.54% | 1,443 | 31.6% |
[ 90.0% - 90.5% ] 90.34% | 1,087 | 27.2% |
[ 91.5% - 92.0% ] 91.85% | 1,903 | 35.5% |
[ 92.0% - 92.5% ] 92.30% | 844 | 40.1% |
[ 93.0% - 93.5% ] 93.47% | 1,256 | 48.7% |
[ 94.0% - 94.5% ] 94.44% | 593 | 30.8% |
[ 96.0% - 96.5% ] 96.40% | 500 | 20.5% |
[ 96.5% - 97.0% ] 96.83% | 1,042 | 43.6% |
[ 97.0% - 97.5% ] 97.27% | 183 | 2.0% |
[ 97.5% - 98.0% ] 97.86% | 841 | 47.1% |
[ 99.5% - 100.0% ] 100.00% | 2,366 | 29.9% |