Sioux Disability Age Under 5
COMPARE
Sioux
Select to Compare
Disability Age Under 5
Sioux Disability Age Under 5
1.8%
DISABILITY | AGE UNDER 5
0.0/ 100
METRIC RATING
326th/ 347
METRIC RANK
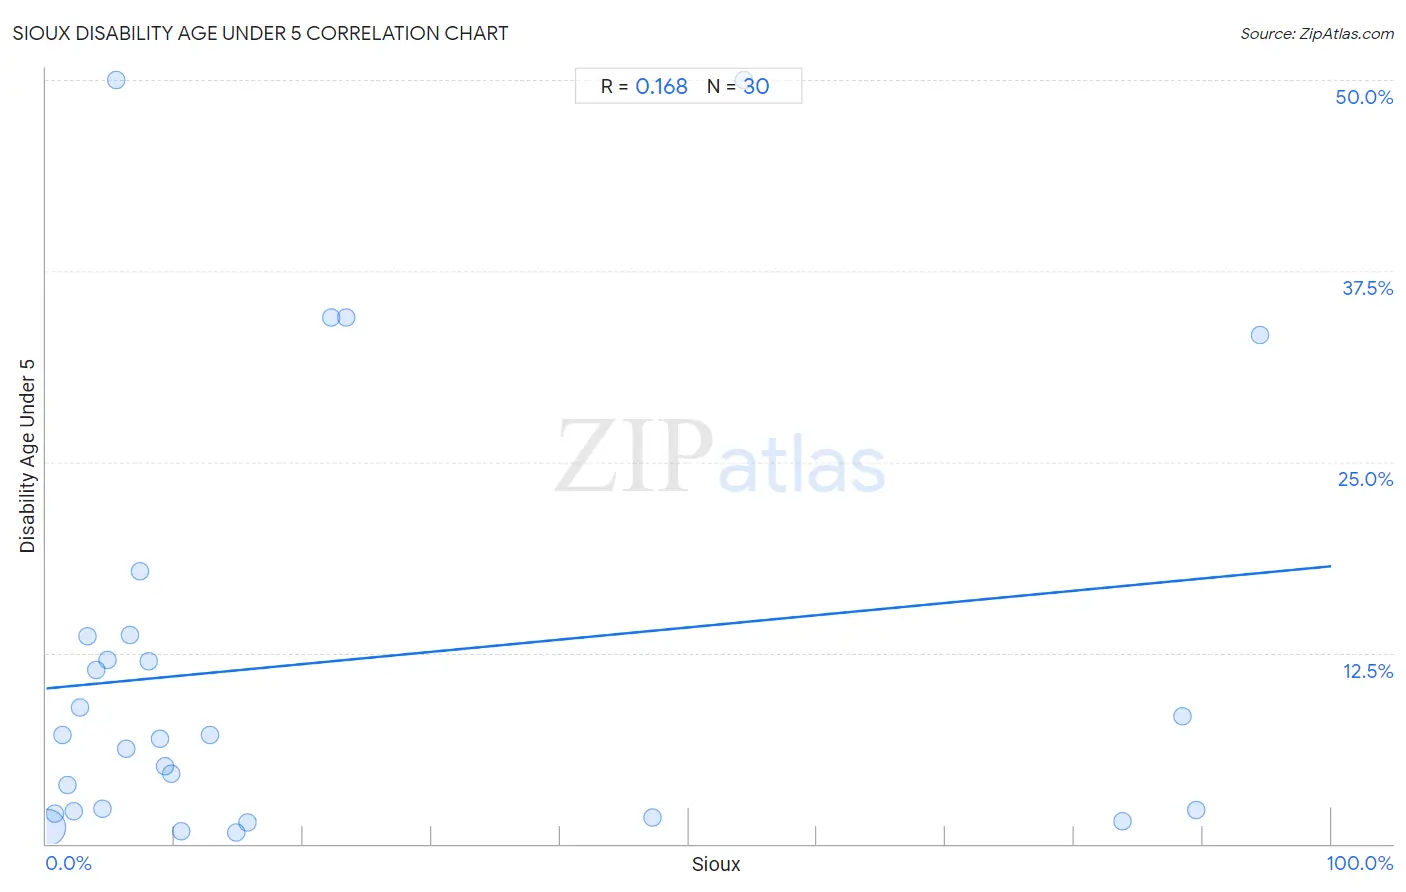
Sioux Disability Age Under 5 Correlation Chart
The statistical analysis conducted on geographies consisting of 151,129,395 people shows a poor positive correlation between the proportion of Sioux and percentage of population with a disability under the age of 5 in the United States with a correlation coefficient (R) of 0.168 and weighted average of 1.8%. On average, for every 1% (one percent) increase in Sioux within a typical geography, there is an increase of 0.080% in percentage of population with a disability under the age of 5.
It is essential to understand that the correlation between the percentage of Sioux and percentage of population with a disability under the age of 5 does not imply a direct cause-and-effect relationship. It remains uncertain whether the presence of Sioux influences an upward or downward trend in the level of percentage of population with a disability under the age of 5 within an area, or if Sioux simply ended up residing in those areas with higher or lower levels of percentage of population with a disability under the age of 5 due to other factors.
Demographics Similar to Sioux by Disability Age Under 5
In terms of disability age under 5, the demographic groups most similar to Sioux are Osage (1.8%, a difference of 0.39%), Immigrants from Portugal (1.8%, a difference of 1.4%), American (1.9%, a difference of 2.1%), Houma (1.9%, a difference of 2.6%), and Cherokee (1.8%, a difference of 2.8%).
| Demographics | Rating | Rank | Disability Age Under 5 |
| Slovaks | 0.0 /100 | #319 | Tragic 1.7% |
| Scotch-Irish | 0.0 /100 | #320 | Tragic 1.7% |
| Ottawa | 0.0 /100 | #321 | Tragic 1.7% |
| Germans | 0.0 /100 | #322 | Tragic 1.7% |
| Chickasaw | 0.0 /100 | #323 | Tragic 1.7% |
| Cherokee | 0.0 /100 | #324 | Tragic 1.8% |
| Immigrants from Portugal | 0.0 /100 | #325 | Tragic 1.8% |
| Sioux | 0.0 /100 | #326 | Tragic 1.8% |
| Osage | 0.0 /100 | #327 | Tragic 1.8% |
| Americans | 0.0 /100 | #328 | Tragic 1.9% |
| Houma | 0.0 /100 | #329 | Tragic 1.9% |
| Choctaw | 0.0 /100 | #330 | Tragic 1.9% |
| French Canadians | 0.0 /100 | #331 | Tragic 1.9% |
| Chippewa | 0.0 /100 | #332 | Tragic 1.9% |
| Dutch West Indians | 0.0 /100 | #333 | Tragic 1.9% |
Sioux Disability Age Under 5 Correlation Summary
| Measurement | Sioux Data | Disability Age Under 5 Data |
| Minimum | 0.056% | 0.72% |
| Maximum | 94.5% | 50.0% |
| Range | 94.4% | 49.3% |
| Mean | 21.4% | 11.9% |
| Median | 8.4% | 7.0% |
| Interquartile 25% (IQ1) | 3.9% | 2.1% |
| Interquartile 75% (IQ3) | 22.1% | 13.6% |
| Interquartile Range (IQR) | 18.2% | 11.5% |
| Standard Deviation (Sample) | 29.7% | 14.1% |
| Standard Deviation (Population) | 29.2% | 13.9% |
Correlation Details
| Sioux Percentile | Sample Size | Disability Age Under 5 |
[ 0.0% - 0.5% ] 0.056% | 148,388,353 | 1.1% |
[ 0.5% - 1.0% ] 0.68% | 1,838,443 | 1.9% |
[ 1.0% - 1.5% ] 1.23% | 133,558 | 7.1% |
[ 1.5% - 2.0% ] 1.70% | 94,988 | 3.9% |
[ 2.0% - 2.5% ] 2.16% | 412,250 | 2.1% |
[ 2.5% - 3.0% ] 2.66% | 14,123 | 8.9% |
[ 3.0% - 3.5% ] 3.16% | 17,485 | 13.6% |
[ 3.5% - 4.0% ] 3.91% | 1,533 | 11.4% |
[ 4.0% - 4.5% ] 4.37% | 39,633 | 2.3% |
[ 4.5% - 5.0% ] 4.79% | 876 | 12.0% |
[ 5.0% - 5.5% ] 5.41% | 148 | 50.0% |
[ 6.0% - 6.5% ] 6.27% | 5,790 | 6.2% |
[ 6.5% - 7.0% ] 6.53% | 1,209 | 13.7% |
[ 7.0% - 7.5% ] 7.31% | 3,982 | 17.8% |
[ 7.5% - 8.0% ] 7.95% | 805 | 12.0% |
[ 8.5% - 9.0% ] 8.89% | 14,619 | 6.9% |
[ 9.0% - 9.5% ] 9.20% | 10,190 | 5.1% |
[ 9.5% - 10.0% ] 9.76% | 15,048 | 4.6% |
[ 10.5% - 11.0% ] 10.52% | 75,632 | 0.79% |
[ 12.5% - 13.0% ] 12.74% | 7,192 | 7.1% |
[ 14.5% - 15.0% ] 14.79% | 45,046 | 0.72% |
[ 15.5% - 16.0% ] 15.63% | 1,753 | 1.4% |
[ 22.0% - 22.5% ] 22.15% | 289 | 34.5% |
[ 23.0% - 23.5% ] 23.36% | 274 | 34.5% |
[ 47.0% - 47.5% ] 47.15% | 2,195 | 1.7% |
[ 54.0% - 54.5% ] 54.24% | 59 | 50.0% |
[ 83.5% - 84.0% ] 83.74% | 1,341 | 1.4% |
[ 88.0% - 88.5% ] 88.38% | 990 | 8.3% |
[ 89.5% - 90.0% ] 89.54% | 1,157 | 2.2% |
[ 94.0% - 94.5% ] 94.47% | 434 | 33.3% |