Sioux Female Disability
COMPARE
Sioux
Select to Compare
Female Disability
Sioux Female Disability
12.9%
DISABILITY | FEMALES
0.1/ 100
METRIC RATING
273rd/ 347
METRIC RANK
Sioux Female Disability Correlation Chart
The statistical analysis conducted on geographies consisting of 234,143,610 people shows a slight negative correlation between the proportion of Sioux and percentage of females with a disability in the United States with a correlation coefficient (R) of -0.076 and weighted average of 12.9%. On average, for every 1% (one percent) increase in Sioux within a typical geography, there is a decrease of 0.013% in percentage of females with a disability.
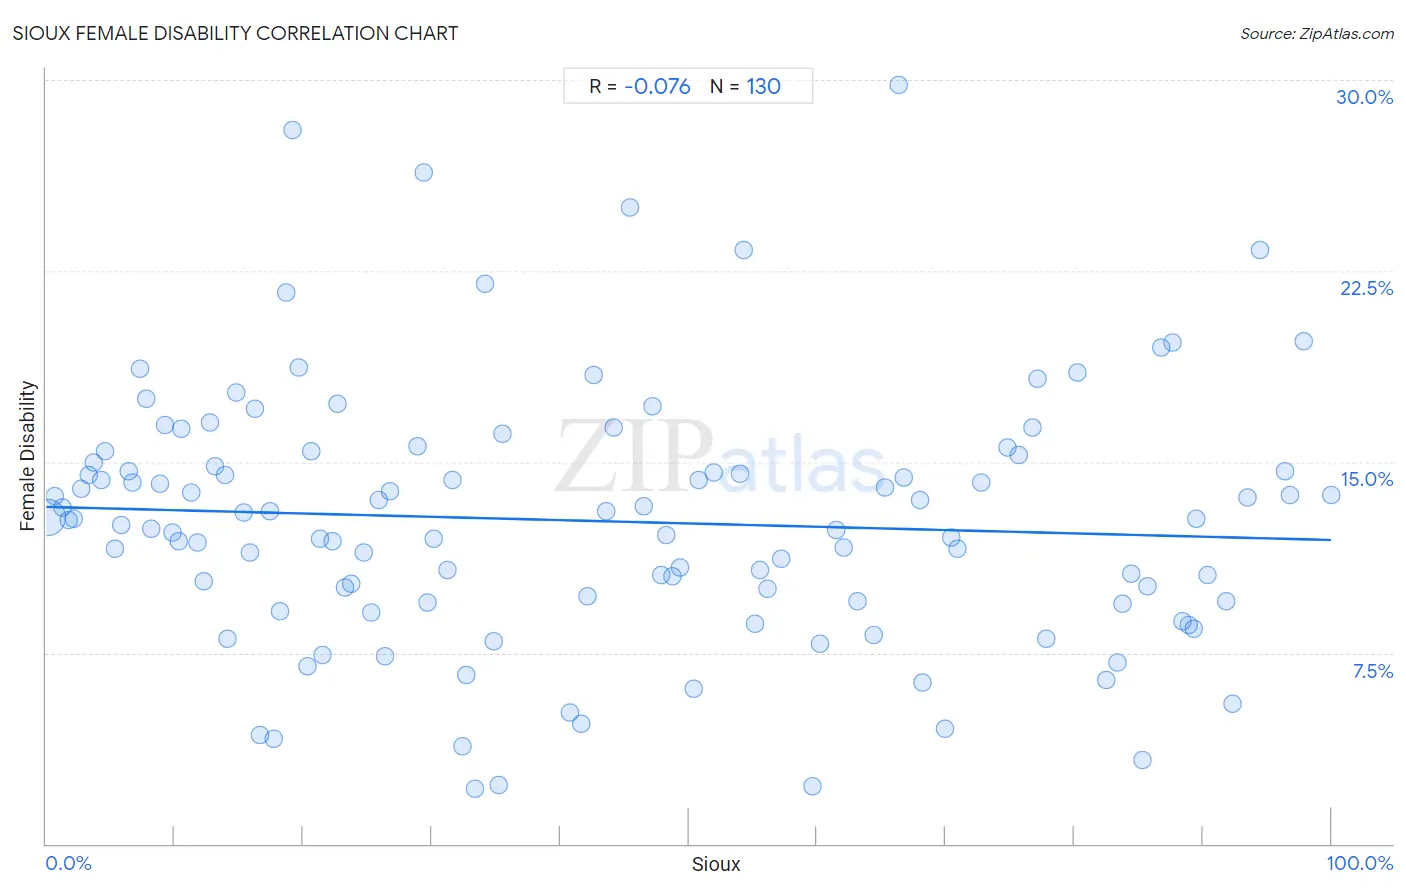
It is essential to understand that the correlation between the percentage of Sioux and percentage of females with a disability does not imply a direct cause-and-effect relationship. It remains uncertain whether the presence of Sioux influences an upward or downward trend in the level of percentage of females with a disability within an area, or if Sioux simply ended up residing in those areas with higher or lower levels of percentage of females with a disability due to other factors.
Demographics Similar to Sioux by Female Disability
In terms of female disability, the demographic groups most similar to Sioux are German (12.9%, a difference of 0.020%), Portuguese (13.0%, a difference of 0.12%), Cheyenne (13.0%, a difference of 0.17%), Immigrants from Dominica (13.0%, a difference of 0.22%), and Dutch (12.9%, a difference of 0.23%).
| Demographics | Rating | Rank | Female Disability |
| Finns | 0.4 /100 | #266 | Tragic 12.8% |
| Senegalese | 0.4 /100 | #267 | Tragic 12.8% |
| Immigrants from Laos | 0.4 /100 | #268 | Tragic 12.8% |
| Indonesians | 0.4 /100 | #269 | Tragic 12.8% |
| Immigrants from Liberia | 0.3 /100 | #270 | Tragic 12.9% |
| Dutch | 0.2 /100 | #271 | Tragic 12.9% |
| Germans | 0.1 /100 | #272 | Tragic 12.9% |
| Sioux | 0.1 /100 | #273 | Tragic 12.9% |
| Portuguese | 0.1 /100 | #274 | Tragic 13.0% |
| Cheyenne | 0.1 /100 | #275 | Tragic 13.0% |
| Immigrants from Dominica | 0.1 /100 | #276 | Tragic 13.0% |
| Spanish | 0.1 /100 | #277 | Tragic 13.0% |
| Scottish | 0.1 /100 | #278 | Tragic 13.0% |
| Arapaho | 0.1 /100 | #279 | Tragic 13.0% |
| Irish | 0.1 /100 | #280 | Tragic 13.1% |
Sioux Female Disability Correlation Summary
| Measurement | Sioux Data | Female Disability Data |
| Minimum | 0.069% | 2.2% |
| Maximum | 100.0% | 29.8% |
| Range | 99.9% | 27.6% |
| Mean | 42.6% | 12.7% |
| Median | 35.4% | 12.7% |
| Interquartile 25% (IQ1) | 16.2% | 9.5% |
| Interquartile 75% (IQ3) | 68.0% | 15.0% |
| Interquartile Range (IQR) | 51.8% | 5.5% |
| Standard Deviation (Sample) | 29.8% | 5.1% |
| Standard Deviation (Population) | 29.7% | 5.1% |
Correlation Details
| Sioux Percentile | Sample Size | Female Disability |
[ 0.0% - 0.5% ] 0.069% | 226,377,286 | 12.8% |
[ 0.5% - 1.0% ] 0.68% | 4,528,134 | 13.6% |
[ 1.0% - 1.5% ] 1.23% | 1,036,386 | 13.2% |
[ 1.5% - 2.0% ] 1.71% | 477,154 | 12.7% |
[ 2.0% - 2.5% ] 2.18% | 605,486 | 12.8% |
[ 2.5% - 3.0% ] 2.73% | 179,524 | 14.0% |
[ 3.0% - 3.5% ] 3.27% | 162,489 | 14.5% |
[ 3.5% - 4.0% ] 3.72% | 81,140 | 15.0% |
[ 4.0% - 4.5% ] 4.29% | 98,447 | 14.3% |
[ 4.5% - 5.0% ] 4.59% | 47,526 | 15.4% |
[ 5.0% - 5.5% ] 5.30% | 24,736 | 11.6% |
[ 5.5% - 6.0% ] 5.81% | 21,661 | 12.5% |
[ 6.0% - 6.5% ] 6.38% | 43,052 | 14.6% |
[ 6.5% - 7.0% ] 6.74% | 33,554 | 14.2% |
[ 7.0% - 7.5% ] 7.29% | 6,337 | 18.7% |
[ 7.5% - 8.0% ] 7.79% | 4,427 | 17.5% |
[ 8.0% - 8.5% ] 8.21% | 4,177 | 12.4% |
[ 8.5% - 9.0% ] 8.87% | 20,915 | 14.2% |
[ 9.0% - 9.5% ] 9.20% | 12,809 | 16.5% |
[ 9.5% - 10.0% ] 9.83% | 41,462 | 12.2% |
[ 10.0% - 10.5% ] 10.26% | 3,420 | 11.9% |
[ 10.5% - 11.0% ] 10.52% | 75,762 | 16.3% |
[ 11.0% - 11.5% ] 11.30% | 27,472 | 13.8% |
[ 11.5% - 12.0% ] 11.74% | 2,939 | 11.8% |
[ 12.0% - 12.5% ] 12.23% | 7,301 | 10.3% |
[ 12.5% - 13.0% ] 12.75% | 11,996 | 16.6% |
[ 13.0% - 13.5% ] 13.11% | 1,205 | 14.8% |
[ 13.5% - 14.0% ] 13.89% | 3,601 | 14.5% |
[ 14.0% - 14.5% ] 14.10% | 539 | 8.0% |
[ 14.5% - 15.0% ] 14.79% | 47,190 | 17.7% |
[ 15.0% - 15.5% ] 15.38% | 5,721 | 13.0% |
[ 15.5% - 16.0% ] 15.81% | 7,679 | 11.4% |
[ 16.0% - 16.5% ] 16.24% | 862 | 17.1% |
[ 16.5% - 17.0% ] 16.61% | 313 | 4.3% |
[ 17.0% - 17.5% ] 17.42% | 6,057 | 13.1% |
[ 17.5% - 18.0% ] 17.75% | 1,014 | 4.1% |
[ 18.0% - 18.5% ] 18.16% | 3,508 | 9.2% |
[ 18.5% - 19.0% ] 18.71% | 433 | 21.7% |
[ 19.0% - 19.5% ] 19.18% | 365 | 28.0% |
[ 19.5% - 20.0% ] 19.62% | 4,199 | 18.7% |
[ 20.0% - 20.5% ] 20.30% | 739 | 7.0% |
[ 20.5% - 21.0% ] 20.64% | 5,529 | 15.4% |
[ 21.0% - 21.5% ] 21.27% | 1,763 | 12.0% |
[ 21.5% - 22.0% ] 21.54% | 65 | 7.4% |
[ 22.0% - 22.5% ] 22.25% | 3,812 | 11.9% |
[ 22.5% - 23.0% ] 22.66% | 1,284 | 17.3% |
[ 23.0% - 23.5% ] 23.22% | 715 | 10.1% |
[ 23.5% - 24.0% ] 23.71% | 97 | 10.2% |
[ 24.5% - 25.0% ] 24.74% | 5,437 | 11.5% |
[ 25.0% - 25.5% ] 25.31% | 976 | 9.1% |
[ 25.5% - 26.0% ] 25.87% | 688 | 13.5% |
[ 26.0% - 26.5% ] 26.39% | 1,353 | 7.4% |
[ 26.5% - 27.0% ] 26.74% | 2,315 | 13.9% |
[ 28.5% - 29.0% ] 28.94% | 1,479 | 15.6% |
[ 29.0% - 29.5% ] 29.42% | 503 | 26.4% |
[ 29.5% - 30.0% ] 29.71% | 414 | 9.5% |
[ 30.0% - 30.5% ] 30.15% | 534 | 12.0% |
[ 31.0% - 31.5% ] 31.20% | 484 | 10.7% |
[ 31.5% - 32.0% ] 31.58% | 95 | 14.3% |
[ 32.0% - 32.5% ] 32.35% | 68 | 3.8% |
[ 32.5% - 33.0% ] 32.73% | 440 | 6.6% |
[ 33.0% - 33.5% ] 33.33% | 75 | 2.2% |
[ 34.0% - 34.5% ] 34.17% | 1,235 | 22.0% |
[ 34.5% - 35.0% ] 34.85% | 858 | 8.0% |
[ 35.0% - 35.5% ] 35.20% | 125 | 2.3% |
[ 35.5% - 36.0% ] 35.54% | 1,210 | 16.1% |
[ 40.5% - 41.0% ] 40.74% | 842 | 5.2% |
[ 41.5% - 42.0% ] 41.63% | 627 | 4.7% |
[ 42.0% - 42.5% ] 42.16% | 1,155 | 9.7% |
[ 42.5% - 43.0% ] 42.65% | 272 | 18.4% |
[ 43.5% - 44.0% ] 43.61% | 876 | 13.1% |
[ 44.0% - 44.5% ] 44.17% | 1,621 | 16.3% |
[ 45.0% - 45.5% ] 45.45% | 22 | 25.0% |
[ 46.5% - 47.0% ] 46.50% | 286 | 13.3% |
[ 47.0% - 47.5% ] 47.15% | 2,195 | 17.2% |
[ 47.5% - 48.0% ] 47.83% | 3,410 | 10.5% |
[ 48.0% - 48.5% ] 48.22% | 197 | 12.1% |
[ 48.5% - 49.0% ] 48.75% | 681 | 10.5% |
[ 49.0% - 49.5% ] 49.30% | 3,509 | 10.9% |
[ 50.0% - 50.5% ] 50.36% | 2,921 | 6.1% |
[ 50.5% - 51.0% ] 50.74% | 1,346 | 14.3% |
[ 51.5% - 52.0% ] 51.90% | 395 | 14.6% |
[ 53.5% - 54.0% ] 53.99% | 1,504 | 14.5% |
[ 54.0% - 54.5% ] 54.24% | 59 | 23.3% |
[ 55.0% - 55.5% ] 55.13% | 5,389 | 8.7% |
[ 55.5% - 56.0% ] 55.50% | 218 | 10.8% |
[ 56.0% - 56.5% ] 56.14% | 6,596 | 10.0% |
[ 57.0% - 57.5% ] 57.21% | 3,905 | 11.2% |
[ 59.5% - 60.0% ] 59.58% | 574 | 2.2% |
[ 60.0% - 60.5% ] 60.20% | 912 | 7.9% |
[ 61.0% - 61.5% ] 61.48% | 283 | 12.3% |
[ 62.0% - 62.5% ] 62.10% | 926 | 11.6% |
[ 63.0% - 63.5% ] 63.12% | 526 | 9.5% |
[ 64.0% - 64.5% ] 64.38% | 146 | 8.2% |
[ 65.0% - 65.5% ] 65.24% | 1,168 | 14.0% |
[ 66.0% - 66.5% ] 66.30% | 362 | 29.8% |
[ 66.5% - 67.0% ] 66.75% | 2,439 | 14.4% |
[ 67.5% - 68.0% ] 67.99% | 2,009 | 13.5% |
[ 68.0% - 68.5% ] 68.23% | 3,516 | 6.3% |
[ 69.5% - 70.0% ] 69.90% | 1,256 | 4.5% |
[ 70.0% - 70.5% ] 70.42% | 896 | 12.0% |
[ 70.5% - 71.0% ] 70.93% | 626 | 11.6% |
[ 72.5% - 73.0% ] 72.72% | 766 | 14.2% |
[ 74.5% - 75.0% ] 74.78% | 1,812 | 15.6% |
[ 75.5% - 76.0% ] 75.64% | 2,274 | 15.3% |
[ 76.5% - 77.0% ] 76.79% | 280 | 16.3% |
[ 77.0% - 77.5% ] 77.10% | 262 | 18.3% |
[ 77.5% - 78.0% ] 77.82% | 586 | 8.0% |
[ 80.0% - 80.5% ] 80.26% | 233 | 18.5% |
[ 82.0% - 82.5% ] 82.47% | 3,629 | 6.4% |
[ 83.0% - 83.5% ] 83.33% | 144 | 7.1% |
[ 83.5% - 84.0% ] 83.79% | 7,820 | 9.4% |
[ 84.0% - 84.5% ] 84.39% | 410 | 10.6% |
[ 85.0% - 85.5% ] 85.30% | 2,572 | 3.3% |
[ 85.5% - 86.0% ] 85.74% | 2,097 | 10.1% |
[ 86.5% - 87.0% ] 86.77% | 3,484 | 19.5% |
[ 87.5% - 88.0% ] 87.67% | 681 | 19.7% |
[ 88.0% - 88.5% ] 88.38% | 990 | 8.7% |
[ 88.5% - 89.0% ] 88.92% | 343 | 8.6% |
[ 89.0% - 89.5% ] 89.30% | 355 | 8.4% |
[ 89.5% - 90.0% ] 89.54% | 1,443 | 12.7% |
[ 90.0% - 90.5% ] 90.34% | 1,087 | 10.6% |
[ 91.5% - 92.0% ] 91.85% | 1,903 | 9.5% |
[ 92.0% - 92.5% ] 92.30% | 844 | 5.5% |
[ 93.0% - 93.5% ] 93.47% | 1,256 | 13.6% |
[ 94.0% - 94.5% ] 94.44% | 593 | 23.3% |
[ 96.0% - 96.5% ] 96.40% | 500 | 14.7% |
[ 96.5% - 97.0% ] 96.83% | 1,042 | 13.7% |
[ 97.5% - 98.0% ] 97.90% | 477 | 19.7% |
[ 99.5% - 100.0% ] 100.00% | 1,491 | 13.7% |