Immigrants from Switzerland 1 or more Vehicles in Household

COMPARE

Immigrants from Switzerland
Race
Ancestry
AfghanAfricanAlaska NativeAlaskan AthabascanAlbanianAleutAlsatianAmericanApacheArabArapahoArgentineanArmenianAssyrian/Chaldean/SyriacAustralianAustrianBahamianBangladeshiBarbadianBasqueBelgianBelizeanBermudanBhutaneseBlackfeetBolivianBrazilianBritishBritish West IndianBulgarianBurmeseCajunCambodianCanadianCape VerdeanCarpatho RusynCelticCentral AmericanCentral American IndianCherokeeCheyenneChickasawChileanChineseChippewaChoctawColombianColvilleComancheCosta RicanCreeCreekCroatianCrowCubanCypriotCzechCzechoslovakianDanishDelawareDominicanDutchDutch West IndianEastern EuropeanEcuadorianEgyptianEnglishEstonianEthiopianEuropeanFijianFilipinoFinnishFrenchFrench American IndianFrench CanadianGermanGerman RussianGhanaianGreekGuamanian/ChamorroGuatemalanGuyaneseHaitianHmongHonduranHopiHoumaHungarianIcelanderIndian (Asian)IndonesianInupiatIranianIraqiIrishIroquoisIsraeliItalianJamaicanJapaneseJordanianKenyanKiowaKoreanLaotianLatvianLebaneseLiberianLithuanianLumbeeLuxembourgerMacedonianMalaysianMalteseMarshalleseMenomineeMexicanMexican American IndianMongolianMoroccanNative HawaiianNavajoNepaleseNew ZealanderNicaraguanNigerianNorthern EuropeanNorwegianOkinawanOsageOttawaPaiutePakistaniPalestinianPanamanianParaguayanPennsylvania GermanPeruvianPimaPolishPortuguesePotawatomiPuebloPuerto RicanPuget Sound SalishRomanianRussianSalvadoranSamoanScandinavianScotch-IrishScottishSeminoleSenegaleseSerbianShoshoneSierra LeoneanSiouxSlavicSlovakSloveneSomaliSouth AfricanSouth AmericanSouth American IndianSoviet UnionSpaniardSpanishSpanish AmericanSpanish American IndianSri LankanSubsaharan AfricanSudaneseSwedishSwissSyrianTaiwaneseThaiTlingit-HaidaTohono O'OdhamTonganTrinidadian and TobagonianTsimshianTurkishU.S. Virgin IslanderUgandanUkrainianUruguayanUteVenezuelanVietnameseWelshWest IndianYakamaYaquiYugoslavianYumanYup'ikZimbabwean
Immigration
NonimmigrantsImmigrantsAfghanistanAfricaAlbaniaArgentinaArmeniaAsiaAustraliaAustriaBahamasBangladeshBarbadosBelarusBelgiumBelizeBoliviaBosnia and HerzegovinaBrazilBulgariaBurma/MyanmarCabo VerdeCambodiaCameroonCanadaCaribbeanCentral AmericaChileChinaColombiaCongoCosta RicaCroatiaCubaCzechoslovakiaDenmarkDominicaDominican RepublicEastern AfricaEastern AsiaEastern EuropeEcuadorEgyptEl SalvadorEnglandEritreaEthiopiaEuropeFijiFranceGermanyGhanaGreeceGrenadaGuatemalaGuyanaHaitiHondurasHong KongHungaryIndiaIndonesiaIranIraqIrelandIsraelItalyJamaicaJapanJordanKazakhstanKenyaKoreaKuwaitLaosLatin AmericaLatviaLebanonLiberiaLithuaniaMalaysiaMexicoMicronesiaMiddle AfricaMoldovaMoroccoNepalNetherlandsNicaraguaNigeriaNorth AmericaNorth MacedoniaNorthern AfricaNorthern EuropeNorwayOceaniaPakistanPanamaPeruPhilippinesPolandPortugalRomaniaRussiaSaudi ArabiaScotlandSenegalSerbiaSierra LeoneSingaporeSomaliaSouth AfricaSouth AmericaSouth Central AsiaSouth Eastern AsiaSouthern EuropeSpainSri LankaSt. Vincent and the GrenadinesSudanSwedenSwitzerlandSyriaTaiwanThailandTrinidad and TobagoTurkeyUgandaUkraineUruguayUzbekistanVenezuelaVietnamWest IndiesWestern AfricaWestern AsiaWestern EuropeYemenZaireZimbabweAzores
Select to Compare
Race
Ancestry
AfghanAfricanAlaska NativeAlaskan AthabascanAlbanianAleutAlsatianAmericanApacheArabArapahoArgentineanArmenianAssyrian/Chaldean/SyriacAustralianAustrianBahamianBangladeshiBarbadianBasqueBelgianBelizeanBermudanBhutaneseBlackfeetBolivianBrazilianBritishBritish West IndianBulgarianBurmeseCajunCambodianCanadianCape VerdeanCarpatho RusynCelticCentral AmericanCentral American IndianCherokeeCheyenneChickasawChileanChineseChippewaChoctawColombianColvilleComancheCosta RicanCreeCreekCroatianCrowCubanCypriotCzechCzechoslovakianDanishDelawareDominicanDutchDutch West IndianEastern EuropeanEcuadorianEgyptianEnglishEstonianEthiopianEuropeanFijianFilipinoFinnishFrenchFrench American IndianFrench CanadianGermanGerman RussianGhanaianGreekGuamanian/ChamorroGuatemalanGuyaneseHaitianHmongHonduranHopiHoumaHungarianIcelanderIndian (Asian)IndonesianInupiatIranianIraqiIrishIroquoisIsraeliItalianJamaicanJapaneseJordanianKenyanKiowaKoreanLaotianLatvianLebaneseLiberianLithuanianLumbeeLuxembourgerMacedonianMalaysianMalteseMarshalleseMenomineeMexicanMexican American IndianMongolianMoroccanNative HawaiianNavajoNepaleseNew ZealanderNicaraguanNigerianNorthern EuropeanNorwegianOkinawanOsageOttawaPaiutePakistaniPalestinianPanamanianParaguayanPennsylvania GermanPeruvianPimaPolishPortuguesePotawatomiPuebloPuerto RicanPuget Sound SalishRomanianRussianSalvadoranSamoanScandinavianScotch-IrishScottishSeminoleSenegaleseSerbianShoshoneSierra LeoneanSiouxSlavicSlovakSloveneSomaliSouth AfricanSouth AmericanSouth American IndianSoviet UnionSpaniardSpanishSpanish AmericanSpanish American IndianSri LankanSubsaharan AfricanSudaneseSwedishSwissSyrianTaiwaneseThaiTlingit-HaidaTohono O'OdhamTonganTrinidadian and TobagonianTsimshianTurkishU.S. Virgin IslanderUgandanUkrainianUruguayanUteVenezuelanVietnameseWelshWest IndianYakamaYaquiYugoslavianYumanYup'ikZimbabwean
Immigration
NonimmigrantsImmigrantsAfghanistanAfricaAlbaniaArgentinaArmeniaAsiaAustraliaAustriaBahamasBangladeshBarbadosBelarusBelgiumBelizeBoliviaBosnia and HerzegovinaBrazilBulgariaBurma/MyanmarCabo VerdeCambodiaCameroonCanadaCaribbeanCentral AmericaChileChinaColombiaCongoCosta RicaCroatiaCubaCzechoslovakiaDenmarkDominicaDominican RepublicEastern AfricaEastern AsiaEastern EuropeEcuadorEgyptEl SalvadorEnglandEritreaEthiopiaEuropeFijiFranceGermanyGhanaGreeceGrenadaGuatemalaGuyanaHaitiHondurasHong KongHungaryIndiaIndonesiaIranIraqIrelandIsraelItalyJamaicaJapanJordanKazakhstanKenyaKoreaKuwaitLaosLatin AmericaLatviaLebanonLiberiaLithuaniaMalaysiaMexicoMicronesiaMiddle AfricaMoldovaMoroccoNepalNetherlandsNicaraguaNigeriaNorth AmericaNorth MacedoniaNorthern AfricaNorthern EuropeNorwayOceaniaPakistanPanamaPeruPhilippinesPolandPortugalRomaniaRussiaSaudi ArabiaScotlandSenegalSerbiaSierra LeoneSingaporeSomaliaSouth AfricaSouth AmericaSouth Central AsiaSouth Eastern AsiaSouthern EuropeSpainSri LankaSt. Vincent and the GrenadinesSudanSwedenSyriaTaiwanThailandTrinidad and TobagoTurkeyUgandaUkraineUruguayUzbekistanVenezuelaVietnamWest IndiesWestern AfricaWestern AsiaWestern EuropeYemenZaireZimbabweAzores
1 or more Vehicles in Household
Income
Poverty
Unemployment
Labor Participation
Family Structure
Vehicle Availability
Education Level
Disability

Immigrants from Switzerland 1 or more Vehicles in Household
Tragic

87.9%
1+ VEHICLES AVAILABLE
0.6/ 100
METRIC RATING
261st/ 347
METRIC RANK

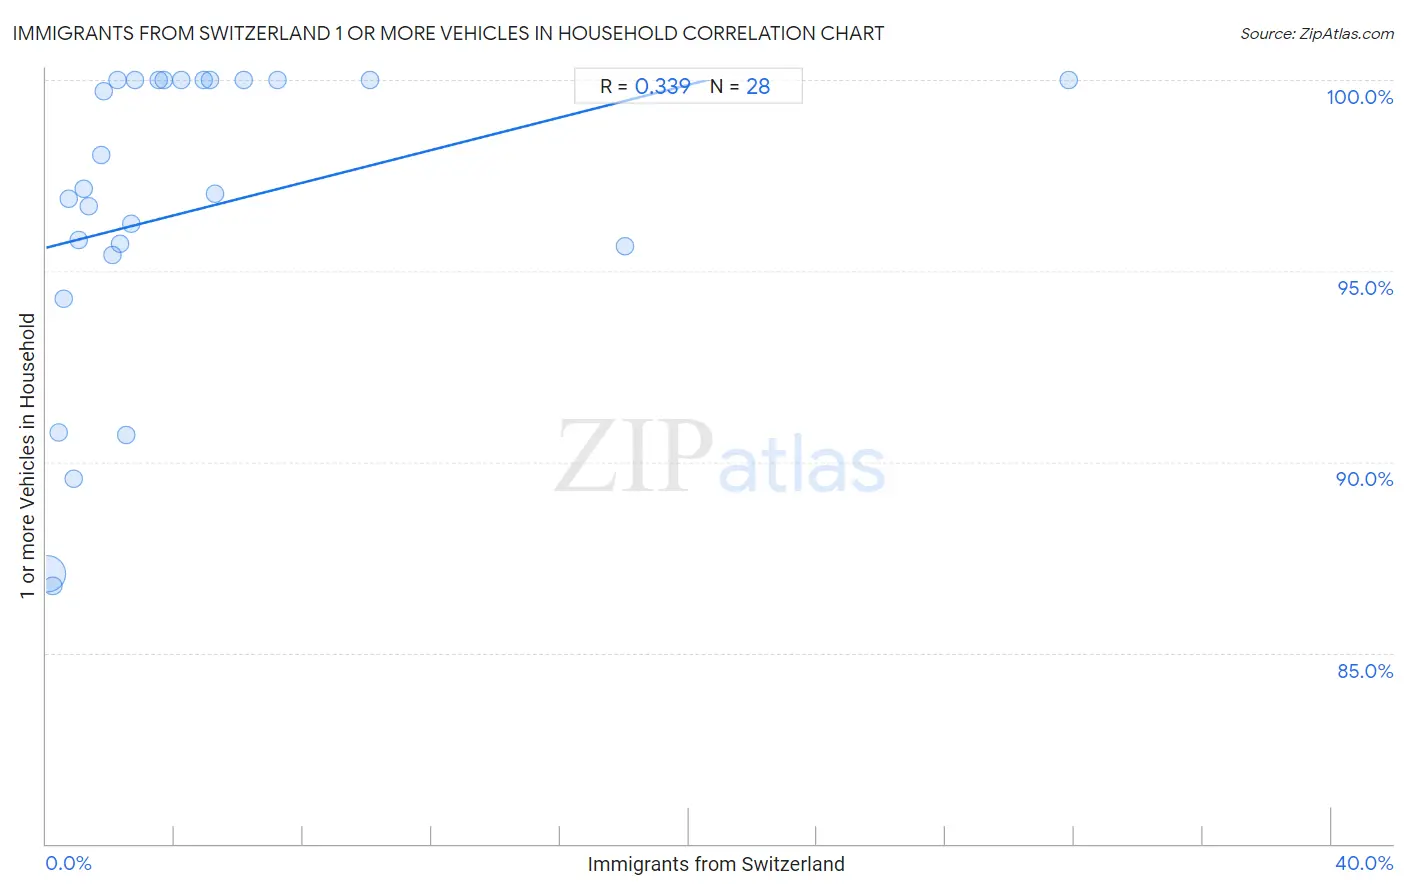
Immigrants from Switzerland 1 or more Vehicles in Household Correlation Chart

The statistical analysis conducted on geographies consisting of 148,062,168 people shows a mild positive correlation between the proportion of Immigrants from Switzerland and percentage of households with 1 or more vehicles available in the United States with a correlation coefficient (R) of 0.339 and weighted average of 87.9%. On average, for every 1% (one percent) increase in Immigrants from Switzerland within a typical geography, there is an increase of 0.21% in percentage of households with 1 or more vehicles available.
Immigrants from Switzerland 1 or more Vehicles in Household
It is essential to understand that the correlation between the percentage of Immigrants from Switzerland and percentage of households with 1 or more vehicles available does not imply a direct cause-and-effect relationship. It remains uncertain whether the presence of Immigrants from Switzerland influences an upward or downward trend in the level of percentage of households with 1 or more vehicles available within an area, or if Immigrants from Switzerland simply ended up residing in those areas with higher or lower levels of percentage of households with 1 or more vehicles available due to other factors.

Demographics Similar to Immigrants from Switzerland by 1 or more Vehicles in Household

In terms of 1 or more vehicles in household, the demographic groups most similar to Immigrants from Switzerland are Subsaharan African (87.9%, a difference of 0.030%), Macedonian (87.9%, a difference of 0.040%), Immigrants from Egypt (87.8%, a difference of 0.10%), Immigrants from Liberia (87.8%, a difference of 0.11%), and Nigerian (88.0%, a difference of 0.13%).
DemographicsRating | Rank1 or more Vehicles in Household
Haitians
0.9
/100
|
#254
Tragic
88.1%
Immigrants from Latvia
0.9
/100
|
#255
Tragic
88.1%
Colombians
0.9
/100
|
#256
Tragic
88.0%
Liberians
0.9
/100
|
#257
Tragic
88.0%
South American Indians
0.9
/100
|
#258
Tragic
88.0%
Nigerians
0.8
/100
|
#259
Tragic
88.0%
Macedonians
0.6
/100
|
#260
Tragic
87.9%
Immigrants from Switzerland
0.6
/100
|
#261
Tragic
87.9%
Sub-Saharan Africans
0.5
/100
|
#262
Tragic
87.9%
Immigrants from Egypt
0.5
/100
|
#263
Tragic
87.8%
Immigrants from Liberia
0.4
/100
|
#264
Tragic
87.8%
Africans
0.4
/100
|
#265
Tragic
87.8%
Israelis
0.3
/100
|
#266
Tragic
87.7%
Immigrants from Colombia
0.3
/100
|
#267
Tragic
87.6%
Immigrants from Europe
0.2
/100
|
#268
Tragic
87.6%

Immigrants from Switzerland 1 or more Vehicles in Household Correlation Summary

MeasurementImmigrants from Switzerland Data1 or more Vehicles in Household Data
Minimum0.033%86.7%
Maximum31.8%100.0%
Range31.8%13.3%
Mean4.4%96.6%
Median2.4%97.1%
Interquartile 25% (IQ1)1.1%95.5%
Interquartile 75% (IQ3)5.0%100.0%
Interquartile Range (IQR)3.9%4.5%
Standard Deviation (Sample)6.5%4.1%
Standard Deviation (Population)6.4%4.0%

Correlation Details

Immigrants from Switzerland PercentileSample Size1 or more Vehicles in Household
[
0.0%
-
0.5%
]
0.033%
140,568,20087.1%
[
0.0%
-
0.5%
]
0.21%
5,758,52386.7%
[
0.0%
-
0.5%
]
0.38%
921,48890.8%
[
0.5%
-
1.0%
]
0.53%
374,58094.3%
[
0.5%
-
1.0%
]
0.68%
181,92096.9%
[
0.5%
-
1.0%
]
0.87%
133,78589.6%
[
1.0%
-
1.5%
]
1.01%
46,65795.8%
[
1.0%
-
1.5%
]
1.17%
31,80297.2%
[
1.0%
-
1.5%
]
1.33%
21,53596.7%
[
1.5%
-
2.0%
]
1.70%
2,23598.0%
[
1.5%
-
2.0%
]
1.81%
2,59899.7%
[
2.0%
-
2.5%
]
2.05%
34295.4%
[
2.0%
-
2.5%
]
2.21%
1,132100.0%
[
2.0%
-
2.5%
]
2.31%
4,29595.7%
[
2.0%
-
2.5%
]
2.47%
5,74390.7%
[
2.5%
-
3.0%
]
2.63%
1,55996.2%
[
2.5%
-
3.0%
]
2.75%
255100.0%
[
3.0%
-
3.5%
]
3.49%
716100.0%
[
3.5%
-
4.0%
]
3.65%
521100.0%
[
4.0%
-
4.5%
]
4.21%
95100.0%
[
4.5%
-
5.0%
]
4.91%
224100.0%
[
5.0%
-
5.5%
]
5.11%
372100.0%
[
5.0%
-
5.5%
]
5.26%
2,37597.0%
[
6.0%
-
6.5%
]
6.14%
114100.0%
[
7.0%
-
7.5%
]
7.21%
319100.0%
[
10.0%
-
10.5%
]
10.09%
228100.0%
[
18.0%
-
18.5%
]
18.00%
51195.7%
[
31.5%
-
32.0%
]
31.82%
44100.0%