Immigrants from Switzerland 2 or more Vehicles in Household

COMPARE

Immigrants from Switzerland
Race
Ancestry
AfghanAfricanAlaska NativeAlaskan AthabascanAlbanianAleutAlsatianAmericanApacheArabArapahoArgentineanArmenianAssyrian/Chaldean/SyriacAustralianAustrianBahamianBangladeshiBarbadianBasqueBelgianBelizeanBermudanBhutaneseBlackfeetBolivianBrazilianBritishBritish West IndianBulgarianBurmeseCajunCambodianCanadianCape VerdeanCarpatho RusynCelticCentral AmericanCentral American IndianCherokeeCheyenneChickasawChileanChineseChippewaChoctawColombianColvilleComancheCosta RicanCreeCreekCroatianCrowCubanCypriotCzechCzechoslovakianDanishDelawareDominicanDutchDutch West IndianEastern EuropeanEcuadorianEgyptianEnglishEstonianEthiopianEuropeanFijianFilipinoFinnishFrenchFrench American IndianFrench CanadianGermanGerman RussianGhanaianGreekGuamanian/ChamorroGuatemalanGuyaneseHaitianHmongHonduranHopiHoumaHungarianIcelanderIndian (Asian)IndonesianInupiatIranianIraqiIrishIroquoisIsraeliItalianJamaicanJapaneseJordanianKenyanKiowaKoreanLaotianLatvianLebaneseLiberianLithuanianLumbeeLuxembourgerMacedonianMalaysianMalteseMarshalleseMenomineeMexicanMexican American IndianMongolianMoroccanNative HawaiianNavajoNepaleseNew ZealanderNicaraguanNigerianNorthern EuropeanNorwegianOkinawanOsageOttawaPaiutePakistaniPalestinianPanamanianParaguayanPennsylvania GermanPeruvianPimaPolishPortuguesePotawatomiPuebloPuerto RicanPuget Sound SalishRomanianRussianSalvadoranSamoanScandinavianScotch-IrishScottishSeminoleSenegaleseSerbianShoshoneSierra LeoneanSiouxSlavicSlovakSloveneSomaliSouth AfricanSouth AmericanSouth American IndianSoviet UnionSpaniardSpanishSpanish AmericanSpanish American IndianSri LankanSubsaharan AfricanSudaneseSwedishSwissSyrianTaiwaneseThaiTlingit-HaidaTohono O'OdhamTonganTrinidadian and TobagonianTsimshianTurkishU.S. Virgin IslanderUgandanUkrainianUruguayanUteVenezuelanVietnameseWelshWest IndianYakamaYaquiYugoslavianYumanYup'ikZimbabwean
Immigration
NonimmigrantsImmigrantsAfghanistanAfricaAlbaniaArgentinaArmeniaAsiaAustraliaAustriaBahamasBangladeshBarbadosBelarusBelgiumBelizeBoliviaBosnia and HerzegovinaBrazilBulgariaBurma/MyanmarCabo VerdeCambodiaCameroonCanadaCaribbeanCentral AmericaChileChinaColombiaCongoCosta RicaCroatiaCubaCzechoslovakiaDenmarkDominicaDominican RepublicEastern AfricaEastern AsiaEastern EuropeEcuadorEgyptEl SalvadorEnglandEritreaEthiopiaEuropeFijiFranceGermanyGhanaGreeceGrenadaGuatemalaGuyanaHaitiHondurasHong KongHungaryIndiaIndonesiaIranIraqIrelandIsraelItalyJamaicaJapanJordanKazakhstanKenyaKoreaKuwaitLaosLatin AmericaLatviaLebanonLiberiaLithuaniaMalaysiaMexicoMicronesiaMiddle AfricaMoldovaMoroccoNepalNetherlandsNicaraguaNigeriaNorth AmericaNorth MacedoniaNorthern AfricaNorthern EuropeNorwayOceaniaPakistanPanamaPeruPhilippinesPolandPortugalRomaniaRussiaSaudi ArabiaScotlandSenegalSerbiaSierra LeoneSingaporeSomaliaSouth AfricaSouth AmericaSouth Central AsiaSouth Eastern AsiaSouthern EuropeSpainSri LankaSt. Vincent and the GrenadinesSudanSwedenSwitzerlandSyriaTaiwanThailandTrinidad and TobagoTurkeyUgandaUkraineUruguayUzbekistanVenezuelaVietnamWest IndiesWestern AfricaWestern AsiaWestern EuropeYemenZaireZimbabweAzores
Select to Compare
Race
Ancestry
AfghanAfricanAlaska NativeAlaskan AthabascanAlbanianAleutAlsatianAmericanApacheArabArapahoArgentineanArmenianAssyrian/Chaldean/SyriacAustralianAustrianBahamianBangladeshiBarbadianBasqueBelgianBelizeanBermudanBhutaneseBlackfeetBolivianBrazilianBritishBritish West IndianBulgarianBurmeseCajunCambodianCanadianCape VerdeanCarpatho RusynCelticCentral AmericanCentral American IndianCherokeeCheyenneChickasawChileanChineseChippewaChoctawColombianColvilleComancheCosta RicanCreeCreekCroatianCrowCubanCypriotCzechCzechoslovakianDanishDelawareDominicanDutchDutch West IndianEastern EuropeanEcuadorianEgyptianEnglishEstonianEthiopianEuropeanFijianFilipinoFinnishFrenchFrench American IndianFrench CanadianGermanGerman RussianGhanaianGreekGuamanian/ChamorroGuatemalanGuyaneseHaitianHmongHonduranHopiHoumaHungarianIcelanderIndian (Asian)IndonesianInupiatIranianIraqiIrishIroquoisIsraeliItalianJamaicanJapaneseJordanianKenyanKiowaKoreanLaotianLatvianLebaneseLiberianLithuanianLumbeeLuxembourgerMacedonianMalaysianMalteseMarshalleseMenomineeMexicanMexican American IndianMongolianMoroccanNative HawaiianNavajoNepaleseNew ZealanderNicaraguanNigerianNorthern EuropeanNorwegianOkinawanOsageOttawaPaiutePakistaniPalestinianPanamanianParaguayanPennsylvania GermanPeruvianPimaPolishPortuguesePotawatomiPuebloPuerto RicanPuget Sound SalishRomanianRussianSalvadoranSamoanScandinavianScotch-IrishScottishSeminoleSenegaleseSerbianShoshoneSierra LeoneanSiouxSlavicSlovakSloveneSomaliSouth AfricanSouth AmericanSouth American IndianSoviet UnionSpaniardSpanishSpanish AmericanSpanish American IndianSri LankanSubsaharan AfricanSudaneseSwedishSwissSyrianTaiwaneseThaiTlingit-HaidaTohono O'OdhamTonganTrinidadian and TobagonianTsimshianTurkishU.S. Virgin IslanderUgandanUkrainianUruguayanUteVenezuelanVietnameseWelshWest IndianYakamaYaquiYugoslavianYumanYup'ikZimbabwean
Immigration
NonimmigrantsImmigrantsAfghanistanAfricaAlbaniaArgentinaArmeniaAsiaAustraliaAustriaBahamasBangladeshBarbadosBelarusBelgiumBelizeBoliviaBosnia and HerzegovinaBrazilBulgariaBurma/MyanmarCabo VerdeCambodiaCameroonCanadaCaribbeanCentral AmericaChileChinaColombiaCongoCosta RicaCroatiaCubaCzechoslovakiaDenmarkDominicaDominican RepublicEastern AfricaEastern AsiaEastern EuropeEcuadorEgyptEl SalvadorEnglandEritreaEthiopiaEuropeFijiFranceGermanyGhanaGreeceGrenadaGuatemalaGuyanaHaitiHondurasHong KongHungaryIndiaIndonesiaIranIraqIrelandIsraelItalyJamaicaJapanJordanKazakhstanKenyaKoreaKuwaitLaosLatin AmericaLatviaLebanonLiberiaLithuaniaMalaysiaMexicoMicronesiaMiddle AfricaMoldovaMoroccoNepalNetherlandsNicaraguaNigeriaNorth AmericaNorth MacedoniaNorthern AfricaNorthern EuropeNorwayOceaniaPakistanPanamaPeruPhilippinesPolandPortugalRomaniaRussiaSaudi ArabiaScotlandSenegalSerbiaSierra LeoneSingaporeSomaliaSouth AfricaSouth AmericaSouth Central AsiaSouth Eastern AsiaSouthern EuropeSpainSri LankaSt. Vincent and the GrenadinesSudanSwedenSyriaTaiwanThailandTrinidad and TobagoTurkeyUgandaUkraineUruguayUzbekistanVenezuelaVietnamWest IndiesWestern AfricaWestern AsiaWestern EuropeYemenZaireZimbabweAzores
2 or more Vehicles in Household
Income
Poverty
Unemployment
Labor Participation
Family Structure
Vehicle Availability
Education Level
Disability

Immigrants from Switzerland 2 or more Vehicles in Household
Tragic

53.4%
2+ VEHICLES AVAILABLE
3.0/ 100
METRIC RATING
234th/ 347
METRIC RANK

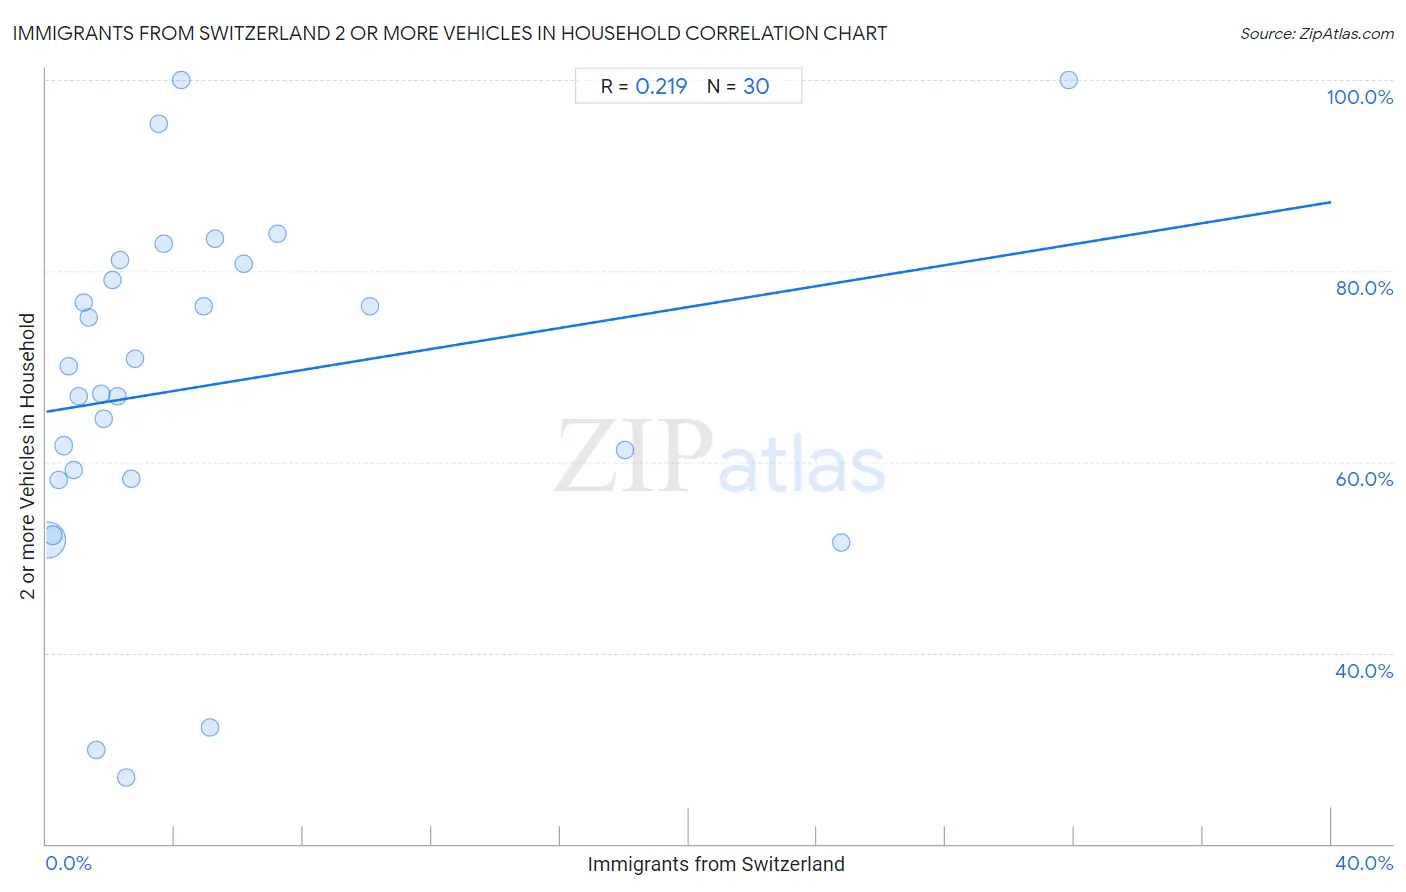
Immigrants from Switzerland 2 or more Vehicles in Household Correlation Chart

The statistical analysis conducted on geographies consisting of 148,072,536 people shows a weak positive correlation between the proportion of Immigrants from Switzerland and percentage of households with 2 or more vehicles available in the United States with a correlation coefficient (R) of 0.219 and weighted average of 53.4%. On average, for every 1% (one percent) increase in Immigrants from Switzerland within a typical geography, there is an increase of 0.55% in percentage of households with 2 or more vehicles available.
Immigrants from Switzerland 2 or more Vehicles in Household
It is essential to understand that the correlation between the percentage of Immigrants from Switzerland and percentage of households with 2 or more vehicles available does not imply a direct cause-and-effect relationship. It remains uncertain whether the presence of Immigrants from Switzerland influences an upward or downward trend in the level of percentage of households with 2 or more vehicles available within an area, or if Immigrants from Switzerland simply ended up residing in those areas with higher or lower levels of percentage of households with 2 or more vehicles available due to other factors.

Demographics Similar to Immigrants from Switzerland by 2 or more Vehicles in Household

In terms of 2 or more vehicles in household, the demographic groups most similar to Immigrants from Switzerland are Immigrants from Middle Africa (53.4%, a difference of 0.030%), Immigrants from Guatemala (53.5%, a difference of 0.060%), Ugandan (53.5%, a difference of 0.060%), Panamanian (53.5%, a difference of 0.13%), and Indonesian (53.4%, a difference of 0.13%).
DemographicsRating | Rank2 or more Vehicles in Household
Sudanese
4.1
/100
|
#227
Tragic
53.6%
Alaska Natives
3.9
/100
|
#228
Tragic
53.6%
Immigrants from Turkey
3.8
/100
|
#229
Tragic
53.6%
Immigrants from Nepal
3.6
/100
|
#230
Tragic
53.5%
Panamanians
3.4
/100
|
#231
Tragic
53.5%
Immigrants from Guatemala
3.2
/100
|
#232
Tragic
53.5%
Ugandans
3.2
/100
|
#233
Tragic
53.5%
Immigrants from Switzerland
3.0
/100
|
#234
Tragic
53.4%
Immigrants from Middle Africa
3.0
/100
|
#235
Tragic
53.4%
Indonesians
2.7
/100
|
#236
Tragic
53.4%
Macedonians
2.4
/100
|
#237
Tragic
53.3%
Immigrants from Armenia
2.3
/100
|
#238
Tragic
53.3%
Cambodians
2.3
/100
|
#239
Tragic
53.3%
Immigrants from Europe
2.1
/100
|
#240
Tragic
53.2%
Immigrants from Sierra Leone
2.1
/100
|
#241
Tragic
53.2%

Immigrants from Switzerland 2 or more Vehicles in Household Correlation Summary

MeasurementImmigrants from Switzerland Data2 or more Vehicles in Household Data
Minimum0.033%27.0%
Maximum31.8%100.0%
Range31.8%73.0%
Mean5.0%68.0%
Median2.4%68.6%
Interquartile 25% (IQ1)1.2%58.2%
Interquartile 75% (IQ3)5.1%80.7%
Interquartile Range (IQR)3.9%22.5%
Standard Deviation (Sample)7.3%18.4%
Standard Deviation (Population)7.2%18.1%

Correlation Details

Immigrants from Switzerland PercentileSample Size2 or more Vehicles in Household
[
0.0%
-
0.5%
]
0.033%
140,568,20051.9%
[
0.0%
-
0.5%
]
0.21%
5,758,52352.3%
[
0.0%
-
0.5%
]
0.38%
921,48858.1%
[
0.5%
-
1.0%
]
0.53%
374,58061.7%
[
0.5%
-
1.0%
]
0.68%
181,92070.1%
[
0.5%
-
1.0%
]
0.87%
133,78559.2%
[
1.0%
-
1.5%
]
1.01%
46,65766.8%
[
1.0%
-
1.5%
]
1.17%
31,80276.6%
[
1.0%
-
1.5%
]
1.33%
21,53575.1%
[
1.5%
-
2.0%
]
1.55%
10,27129.8%
[
1.5%
-
2.0%
]
1.70%
2,23567.1%
[
1.5%
-
2.0%
]
1.81%
2,59864.5%
[
2.0%
-
2.5%
]
2.05%
34279.1%
[
2.0%
-
2.5%
]
2.21%
1,13266.8%
[
2.0%
-
2.5%
]
2.31%
4,29581.2%
[
2.0%
-
2.5%
]
2.47%
5,74327.0%
[
2.5%
-
3.0%
]
2.63%
1,55958.2%
[
2.5%
-
3.0%
]
2.75%
25570.8%
[
3.0%
-
3.5%
]
3.49%
71695.4%
[
3.5%
-
4.0%
]
3.65%
52182.8%
[
4.0%
-
4.5%
]
4.21%
95100.0%
[
4.5%
-
5.0%
]
4.91%
22476.3%
[
5.0%
-
5.5%
]
5.11%
37232.2%
[
5.0%
-
5.5%
]
5.26%
2,37583.4%
[
6.0%
-
6.5%
]
6.14%
11480.7%
[
7.0%
-
7.5%
]
7.21%
31983.9%
[
10.0%
-
10.5%
]
10.09%
22876.3%
[
18.0%
-
18.5%
]
18.00%
51161.3%
[
24.5%
-
25.0%
]
24.74%
9751.5%
[
31.5%
-
32.0%
]
31.82%
44100.0%