Immigrants from Switzerland GED/Equivalency

COMPARE

Immigrants from Switzerland
Race
Ancestry
AfghanAfricanAlaska NativeAlaskan AthabascanAlbanianAleutAlsatianAmericanApacheArabArapahoArgentineanArmenianAssyrian/Chaldean/SyriacAustralianAustrianBahamianBangladeshiBarbadianBasqueBelgianBelizeanBermudanBhutaneseBlackfeetBolivianBrazilianBritishBritish West IndianBulgarianBurmeseCajunCambodianCanadianCape VerdeanCarpatho RusynCelticCentral AmericanCentral American IndianCherokeeCheyenneChickasawChileanChineseChippewaChoctawColombianColvilleComancheCosta RicanCreeCreekCroatianCrowCubanCypriotCzechCzechoslovakianDanishDelawareDominicanDutchDutch West IndianEastern EuropeanEcuadorianEgyptianEnglishEstonianEthiopianEuropeanFijianFilipinoFinnishFrenchFrench American IndianFrench CanadianGermanGerman RussianGhanaianGreekGuamanian/ChamorroGuatemalanGuyaneseHaitianHmongHonduranHopiHoumaHungarianIcelanderIndian (Asian)IndonesianInupiatIranianIraqiIrishIroquoisIsraeliItalianJamaicanJapaneseJordanianKenyanKiowaKoreanLaotianLatvianLebaneseLiberianLithuanianLumbeeLuxembourgerMacedonianMalaysianMalteseMarshalleseMenomineeMexicanMexican American IndianMongolianMoroccanNative HawaiianNavajoNepaleseNew ZealanderNicaraguanNigerianNorthern EuropeanNorwegianOkinawanOsageOttawaPaiutePakistaniPalestinianPanamanianParaguayanPennsylvania GermanPeruvianPimaPolishPortuguesePotawatomiPuebloPuerto RicanPuget Sound SalishRomanianRussianSalvadoranSamoanScandinavianScotch-IrishScottishSeminoleSenegaleseSerbianShoshoneSierra LeoneanSiouxSlavicSlovakSloveneSomaliSouth AfricanSouth AmericanSouth American IndianSoviet UnionSpaniardSpanishSpanish AmericanSpanish American IndianSri LankanSubsaharan AfricanSudaneseSwedishSwissSyrianTaiwaneseThaiTlingit-HaidaTohono O'OdhamTonganTrinidadian and TobagonianTsimshianTurkishU.S. Virgin IslanderUgandanUkrainianUruguayanUteVenezuelanVietnameseWelshWest IndianYakamaYaquiYugoslavianYumanYup'ikZimbabwean
Immigration
NonimmigrantsImmigrantsAfghanistanAfricaAlbaniaArgentinaArmeniaAsiaAustraliaAustriaBahamasBangladeshBarbadosBelarusBelgiumBelizeBoliviaBosnia and HerzegovinaBrazilBulgariaBurma/MyanmarCabo VerdeCambodiaCameroonCanadaCaribbeanCentral AmericaChileChinaColombiaCongoCosta RicaCroatiaCubaCzechoslovakiaDenmarkDominicaDominican RepublicEastern AfricaEastern AsiaEastern EuropeEcuadorEgyptEl SalvadorEnglandEritreaEthiopiaEuropeFijiFranceGermanyGhanaGreeceGrenadaGuatemalaGuyanaHaitiHondurasHong KongHungaryIndiaIndonesiaIranIraqIrelandIsraelItalyJamaicaJapanJordanKazakhstanKenyaKoreaKuwaitLaosLatin AmericaLatviaLebanonLiberiaLithuaniaMalaysiaMexicoMicronesiaMiddle AfricaMoldovaMoroccoNepalNetherlandsNicaraguaNigeriaNorth AmericaNorth MacedoniaNorthern AfricaNorthern EuropeNorwayOceaniaPakistanPanamaPeruPhilippinesPolandPortugalRomaniaRussiaSaudi ArabiaScotlandSenegalSerbiaSierra LeoneSingaporeSomaliaSouth AfricaSouth AmericaSouth Central AsiaSouth Eastern AsiaSouthern EuropeSpainSri LankaSt. Vincent and the GrenadinesSudanSwedenSwitzerlandSyriaTaiwanThailandTrinidad and TobagoTurkeyUgandaUkraineUruguayUzbekistanVenezuelaVietnamWest IndiesWestern AfricaWestern AsiaWestern EuropeYemenZaireZimbabweAzores
Select to Compare
Race
Ancestry
AfghanAfricanAlaska NativeAlaskan AthabascanAlbanianAleutAlsatianAmericanApacheArabArapahoArgentineanArmenianAssyrian/Chaldean/SyriacAustralianAustrianBahamianBangladeshiBarbadianBasqueBelgianBelizeanBermudanBhutaneseBlackfeetBolivianBrazilianBritishBritish West IndianBulgarianBurmeseCajunCambodianCanadianCape VerdeanCarpatho RusynCelticCentral AmericanCentral American IndianCherokeeCheyenneChickasawChileanChineseChippewaChoctawColombianColvilleComancheCosta RicanCreeCreekCroatianCrowCubanCypriotCzechCzechoslovakianDanishDelawareDominicanDutchDutch West IndianEastern EuropeanEcuadorianEgyptianEnglishEstonianEthiopianEuropeanFijianFilipinoFinnishFrenchFrench American IndianFrench CanadianGermanGerman RussianGhanaianGreekGuamanian/ChamorroGuatemalanGuyaneseHaitianHmongHonduranHopiHoumaHungarianIcelanderIndian (Asian)IndonesianInupiatIranianIraqiIrishIroquoisIsraeliItalianJamaicanJapaneseJordanianKenyanKiowaKoreanLaotianLatvianLebaneseLiberianLithuanianLumbeeLuxembourgerMacedonianMalaysianMalteseMarshalleseMenomineeMexicanMexican American IndianMongolianMoroccanNative HawaiianNavajoNepaleseNew ZealanderNicaraguanNigerianNorthern EuropeanNorwegianOkinawanOsageOttawaPaiutePakistaniPalestinianPanamanianParaguayanPennsylvania GermanPeruvianPimaPolishPortuguesePotawatomiPuebloPuerto RicanPuget Sound SalishRomanianRussianSalvadoranSamoanScandinavianScotch-IrishScottishSeminoleSenegaleseSerbianShoshoneSierra LeoneanSiouxSlavicSlovakSloveneSomaliSouth AfricanSouth AmericanSouth American IndianSoviet UnionSpaniardSpanishSpanish AmericanSpanish American IndianSri LankanSubsaharan AfricanSudaneseSwedishSwissSyrianTaiwaneseThaiTlingit-HaidaTohono O'OdhamTonganTrinidadian and TobagonianTsimshianTurkishU.S. Virgin IslanderUgandanUkrainianUruguayanUteVenezuelanVietnameseWelshWest IndianYakamaYaquiYugoslavianYumanYup'ikZimbabwean
Immigration
NonimmigrantsImmigrantsAfghanistanAfricaAlbaniaArgentinaArmeniaAsiaAustraliaAustriaBahamasBangladeshBarbadosBelarusBelgiumBelizeBoliviaBosnia and HerzegovinaBrazilBulgariaBurma/MyanmarCabo VerdeCambodiaCameroonCanadaCaribbeanCentral AmericaChileChinaColombiaCongoCosta RicaCroatiaCubaCzechoslovakiaDenmarkDominicaDominican RepublicEastern AfricaEastern AsiaEastern EuropeEcuadorEgyptEl SalvadorEnglandEritreaEthiopiaEuropeFijiFranceGermanyGhanaGreeceGrenadaGuatemalaGuyanaHaitiHondurasHong KongHungaryIndiaIndonesiaIranIraqIrelandIsraelItalyJamaicaJapanJordanKazakhstanKenyaKoreaKuwaitLaosLatin AmericaLatviaLebanonLiberiaLithuaniaMalaysiaMexicoMicronesiaMiddle AfricaMoldovaMoroccoNepalNetherlandsNicaraguaNigeriaNorth AmericaNorth MacedoniaNorthern AfricaNorthern EuropeNorwayOceaniaPakistanPanamaPeruPhilippinesPolandPortugalRomaniaRussiaSaudi ArabiaScotlandSenegalSerbiaSierra LeoneSingaporeSomaliaSouth AfricaSouth AmericaSouth Central AsiaSouth Eastern AsiaSouthern EuropeSpainSri LankaSt. Vincent and the GrenadinesSudanSwedenSyriaTaiwanThailandTrinidad and TobagoTurkeyUgandaUkraineUruguayUzbekistanVenezuelaVietnamWest IndiesWestern AfricaWestern AsiaWestern EuropeYemenZaireZimbabweAzores
GED/Equivalency
Income
Poverty
Unemployment
Labor Participation
Family Structure
Vehicle Availability
Education Level
Disability

Immigrants from Switzerland GED/Equivalency
Exceptional

88.1%
GED/EQUIVALENCY
99.5/ 100
METRIC RATING
46th/ 347
METRIC RANK

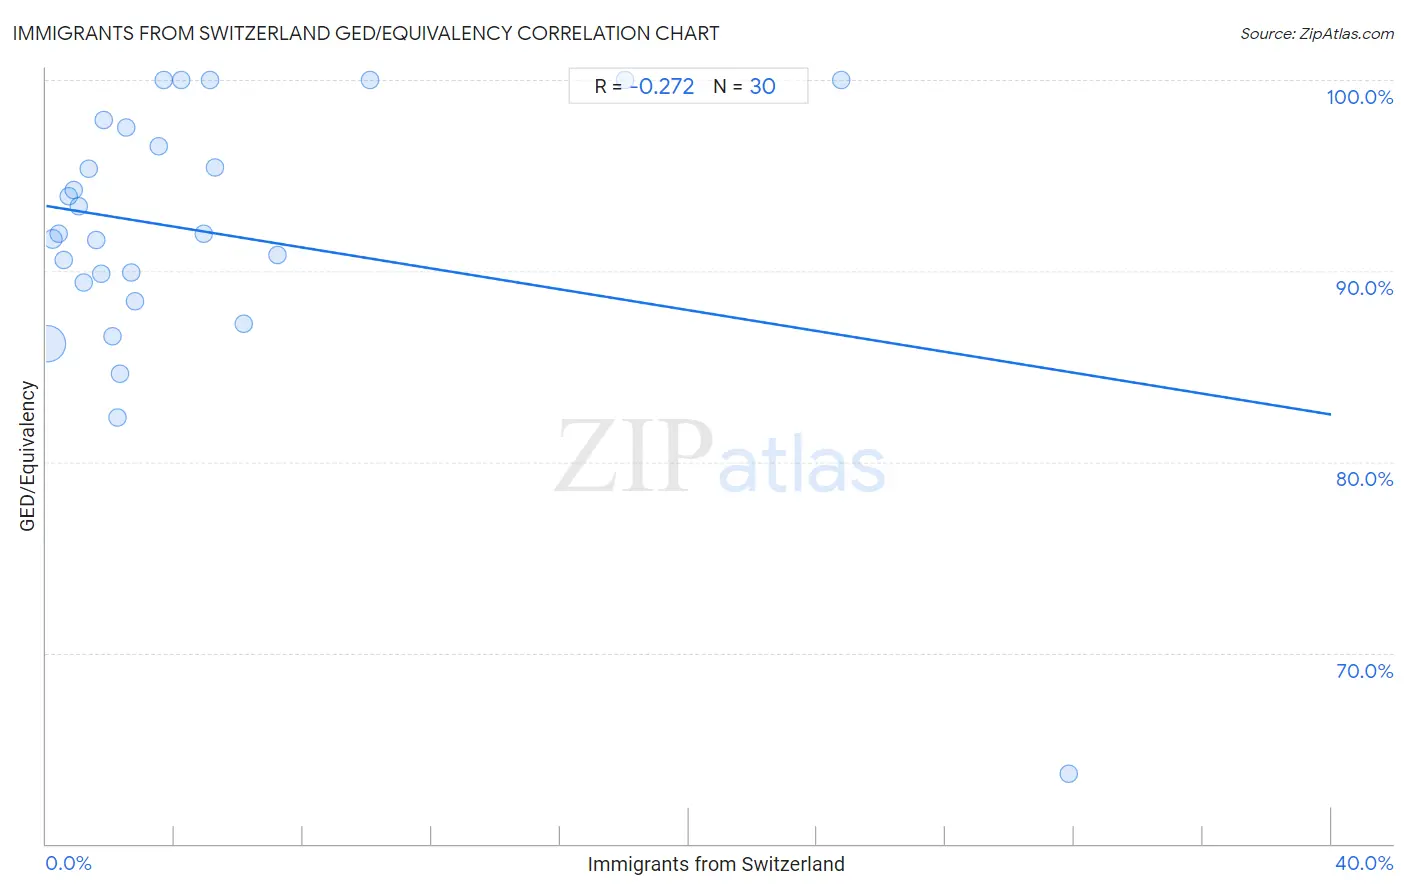
Immigrants from Switzerland GED/Equivalency Correlation Chart

The statistical analysis conducted on geographies consisting of 148,083,583 people shows a weak negative correlation between the proportion of Immigrants from Switzerland and percentage of population with at least ged/equivalency education in the United States with a correlation coefficient (R) of -0.272 and weighted average of 88.1%. On average, for every 1% (one percent) increase in Immigrants from Switzerland within a typical geography, there is a decrease of 0.27% in percentage of population with at least ged/equivalency education.
Immigrants from Switzerland GED/Equivalency
It is essential to understand that the correlation between the percentage of Immigrants from Switzerland and percentage of population with at least ged/equivalency education does not imply a direct cause-and-effect relationship. It remains uncertain whether the presence of Immigrants from Switzerland influences an upward or downward trend in the level of percentage of population with at least ged/equivalency education within an area, or if Immigrants from Switzerland simply ended up residing in those areas with higher or lower levels of percentage of population with at least ged/equivalency education due to other factors.

Demographics Similar to Immigrants from Switzerland by GED/Equivalency

In terms of ged/equivalency, the demographic groups most similar to Immigrants from Switzerland are Immigrants from Latvia (88.1%, a difference of 0.010%), Czech (88.1%, a difference of 0.020%), Greek (88.1%, a difference of 0.020%), Australian (88.1%, a difference of 0.030%), and Immigrants from Korea (88.1%, a difference of 0.040%).
DemographicsRating | RankGED/Equivalency
Immigrants from Israel
99.6
/100
|
#39
Exceptional
88.2%
Italians
99.6
/100
|
#40
Exceptional
88.2%
Finns
99.6
/100
|
#41
Exceptional
88.2%
Cambodians
99.6
/100
|
#42
Exceptional
88.2%
Immigrants from Scotland
99.6
/100
|
#43
Exceptional
88.2%
Macedonians
99.5
/100
|
#44
Exceptional
88.1%
Czechs
99.5
/100
|
#45
Exceptional
88.1%
Immigrants from Switzerland
99.5
/100
|
#46
Exceptional
88.1%
Immigrants from Latvia
99.5
/100
|
#47
Exceptional
88.1%
Greeks
99.5
/100
|
#48
Exceptional
88.1%
Australians
99.5
/100
|
#49
Exceptional
88.1%
Immigrants from Korea
99.5
/100
|
#50
Exceptional
88.1%
Immigrants from Netherlands
99.4
/100
|
#51
Exceptional
88.0%
Zimbabweans
99.4
/100
|
#52
Exceptional
88.0%
Immigrants from South Africa
99.4
/100
|
#53
Exceptional
88.0%

Immigrants from Switzerland GED/Equivalency Correlation Summary

MeasurementImmigrants from Switzerland DataGED/Equivalency Data
Minimum0.033%63.6%
Maximum31.8%100.0%
Range31.8%36.4%
Mean5.0%92.0%
Median2.4%92.0%
Interquartile 25% (IQ1)1.2%89.4%
Interquartile 75% (IQ3)5.1%97.5%
Interquartile Range (IQR)3.9%8.2%
Standard Deviation (Sample)7.3%7.4%
Standard Deviation (Population)7.2%7.2%

Correlation Details

Immigrants from Switzerland PercentileSample SizeGED/Equivalency
[
0.0%
-
0.5%
]
0.033%
140,574,72386.2%
[
0.0%
-
0.5%
]
0.21%
5,760,76691.7%
[
0.0%
-
0.5%
]
0.38%
921,48892.0%
[
0.5%
-
1.0%
]
0.53%
374,58090.5%
[
0.5%
-
1.0%
]
0.68%
181,92093.9%
[
0.5%
-
1.0%
]
0.87%
133,78594.3%
[
1.0%
-
1.5%
]
1.01%
46,65793.4%
[
1.0%
-
1.5%
]
1.17%
31,80289.4%
[
1.0%
-
1.5%
]
1.33%
21,53595.4%
[
1.5%
-
2.0%
]
1.55%
10,27191.6%
[
1.5%
-
2.0%
]
1.70%
2,23589.9%
[
1.5%
-
2.0%
]
1.78%
4,87997.9%
[
2.0%
-
2.5%
]
2.05%
34286.6%
[
2.0%
-
2.5%
]
2.21%
1,13282.4%
[
2.0%
-
2.5%
]
2.31%
4,29584.6%
[
2.0%
-
2.5%
]
2.47%
5,74397.5%
[
2.5%
-
3.0%
]
2.63%
1,55989.9%
[
2.5%
-
3.0%
]
2.75%
25588.4%
[
3.0%
-
3.5%
]
3.49%
71696.5%
[
3.5%
-
4.0%
]
3.65%
521100.0%
[
4.0%
-
4.5%
]
4.21%
95100.0%
[
4.5%
-
5.0%
]
4.91%
22491.9%
[
5.0%
-
5.5%
]
5.11%
372100.0%
[
5.0%
-
5.5%
]
5.26%
2,37595.4%
[
6.0%
-
6.5%
]
6.14%
11487.2%
[
7.0%
-
7.5%
]
7.21%
31990.8%
[
10.0%
-
10.5%
]
10.09%
228100.0%
[
18.0%
-
18.5%
]
18.00%
511100.0%
[
24.5%
-
25.0%
]
24.74%
97100.0%
[
31.5%
-
32.0%
]
31.82%
4463.6%