Immigrants from Sri Lanka 2 or more Vehicles in Household
COMPARE
Immigrants from Sri Lanka
Select to Compare
2 or more Vehicles in Household
Immigrants from Sri Lanka 2 or more Vehicles in Household
55.5%
2+ VEHICLES AVAILABLE
58.3/ 100
METRIC RATING
166th/ 347
METRIC RANK
Immigrants from Sri Lanka 2 or more Vehicles in Household Correlation Chart
The statistical analysis conducted on geographies consisting of 149,689,488 people shows a weak positive correlation between the proportion of Immigrants from Sri Lanka and percentage of households with 2 or more vehicles available in the United States with a correlation coefficient (R) of 0.261 and weighted average of 55.5%. On average, for every 1% (one percent) increase in Immigrants from Sri Lanka within a typical geography, there is an increase of 3.8% in percentage of households with 2 or more vehicles available.
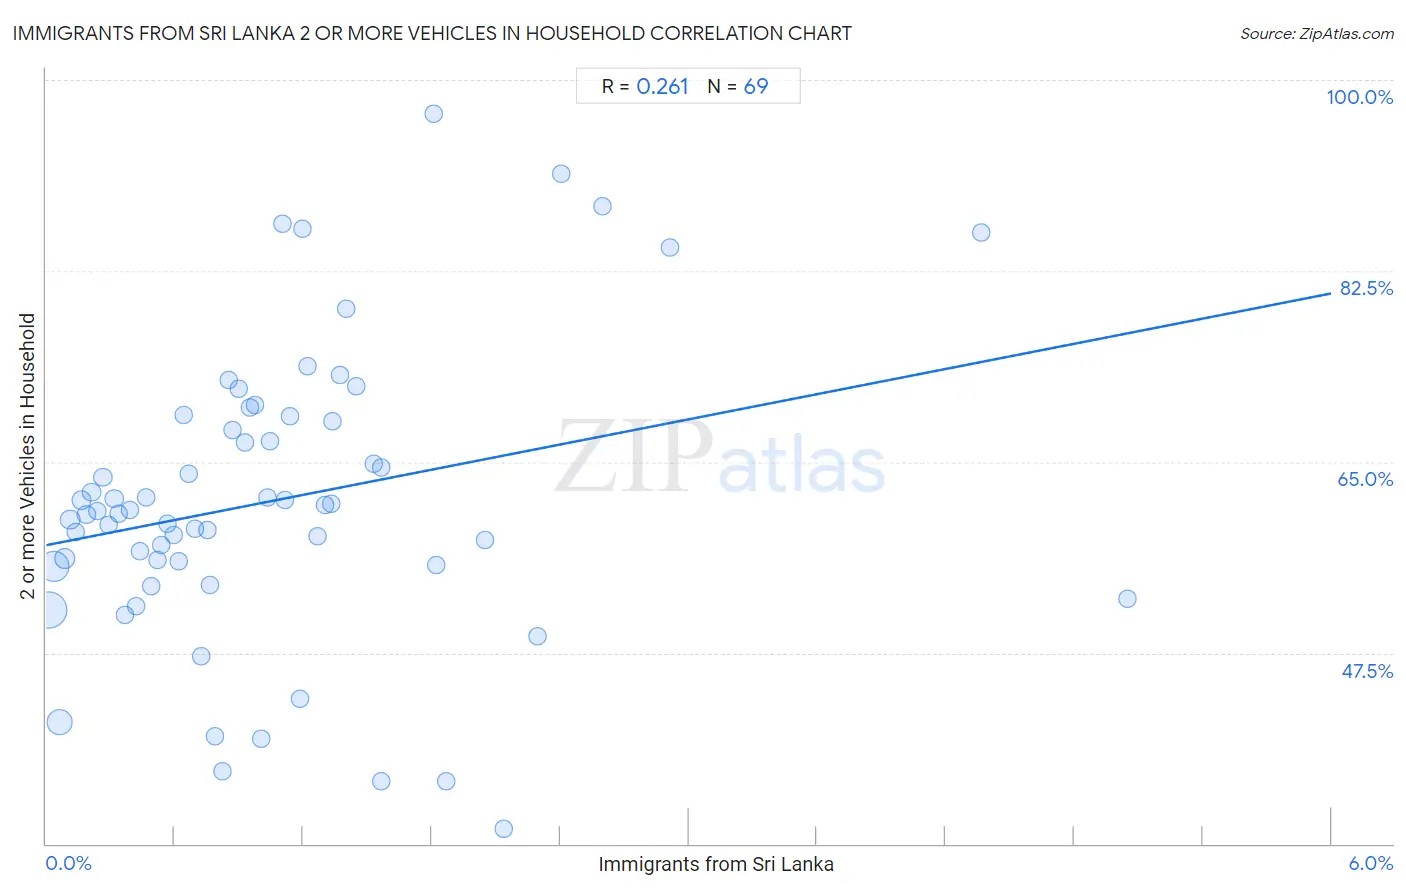
It is essential to understand that the correlation between the percentage of Immigrants from Sri Lanka and percentage of households with 2 or more vehicles available does not imply a direct cause-and-effect relationship. It remains uncertain whether the presence of Immigrants from Sri Lanka influences an upward or downward trend in the level of percentage of households with 2 or more vehicles available within an area, or if Immigrants from Sri Lanka simply ended up residing in those areas with higher or lower levels of percentage of households with 2 or more vehicles available due to other factors.
Demographics Similar to Immigrants from Sri Lanka by 2 or more Vehicles in Household
In terms of 2 or more vehicles in household, the demographic groups most similar to Immigrants from Sri Lanka are Kenyan (55.5%, a difference of 0.010%), Immigrants from El Salvador (55.6%, a difference of 0.040%), Dutch West Indian (55.6%, a difference of 0.060%), French American Indian (55.5%, a difference of 0.070%), and Immigrants from Zimbabwe (55.6%, a difference of 0.080%).
| Demographics | Rating | Rank | 2 or more Vehicles in Household |
| Paiute | 68.0 /100 | #159 | Good 55.8% |
| Crow | 67.0 /100 | #160 | Good 55.7% |
| Colville | 61.1 /100 | #161 | Good 55.6% |
| German Russians | 60.9 /100 | #162 | Good 55.6% |
| Immigrants from Zimbabwe | 60.2 /100 | #163 | Good 55.6% |
| Dutch West Indians | 59.8 /100 | #164 | Average 55.6% |
| Immigrants from El Salvador | 59.4 /100 | #165 | Average 55.6% |
| Immigrants from Sri Lanka | 58.3 /100 | #166 | Average 55.5% |
| Kenyans | 58.1 /100 | #167 | Average 55.5% |
| French American Indians | 56.7 /100 | #168 | Average 55.5% |
| Immigrants from Austria | 56.3 /100 | #169 | Average 55.5% |
| Romanians | 55.8 /100 | #170 | Average 55.5% |
| Immigrants from Costa Rica | 54.4 /100 | #171 | Average 55.4% |
| Immigrants from Nicaragua | 51.6 /100 | #172 | Average 55.4% |
| Immigrants from Western Europe | 51.4 /100 | #173 | Average 55.4% |
Immigrants from Sri Lanka 2 or more Vehicles in Household Correlation Summary
| Measurement | Immigrants from Sri Lanka Data | 2 or more Vehicles in Household Data |
| Minimum | 0.013% | 31.3% |
| Maximum | 5.0% | 96.9% |
| Range | 5.0% | 65.5% |
| Mean | 1.1% | 61.4% |
| Median | 0.87% | 60.5% |
| Interquartile 25% (IQ1) | 0.43% | 55.5% |
| Interquartile 75% (IQ3) | 1.4% | 69.0% |
| Interquartile Range (IQR) | 0.93% | 13.5% |
| Standard Deviation (Sample) | 0.92% | 13.5% |
| Standard Deviation (Population) | 0.91% | 13.4% |
Correlation Details
| Immigrants from Sri Lanka Percentile | Sample Size | 2 or more Vehicles in Household |
[ 0.0% - 0.5% ] 0.013% | 55,634,119 | 51.4% |
[ 0.0% - 0.5% ] 0.037% | 36,314,504 | 55.4% |
[ 0.0% - 0.5% ] 0.062% | 24,312,188 | 41.1% |
[ 0.0% - 0.5% ] 0.087% | 8,897,531 | 56.2% |
[ 0.0% - 0.5% ] 0.11% | 6,231,687 | 59.7% |
[ 0.0% - 0.5% ] 0.14% | 3,273,576 | 58.6% |
[ 0.0% - 0.5% ] 0.16% | 2,213,435 | 61.5% |
[ 0.0% - 0.5% ] 0.19% | 2,540,892 | 60.2% |
[ 0.0% - 0.5% ] 0.21% | 1,564,987 | 62.2% |
[ 0.0% - 0.5% ] 0.24% | 1,147,156 | 60.5% |
[ 0.0% - 0.5% ] 0.27% | 1,430,343 | 63.6% |
[ 0.0% - 0.5% ] 0.29% | 848,138 | 59.2% |
[ 0.0% - 0.5% ] 0.32% | 746,064 | 61.6% |
[ 0.0% - 0.5% ] 0.34% | 425,560 | 60.2% |
[ 0.0% - 0.5% ] 0.37% | 309,492 | 50.9% |
[ 0.0% - 0.5% ] 0.39% | 282,864 | 60.6% |
[ 0.0% - 0.5% ] 0.42% | 650,090 | 51.8% |
[ 0.0% - 0.5% ] 0.44% | 270,204 | 56.9% |
[ 0.0% - 0.5% ] 0.47% | 503,926 | 61.8% |
[ 0.0% - 0.5% ] 0.49% | 275,868 | 53.6% |
[ 0.5% - 1.0% ] 0.52% | 132,774 | 56.0% |
[ 0.5% - 1.0% ] 0.54% | 170,558 | 57.4% |
[ 0.5% - 1.0% ] 0.57% | 235,928 | 59.3% |
[ 0.5% - 1.0% ] 0.60% | 143,787 | 58.3% |
[ 0.5% - 1.0% ] 0.62% | 48,463 | 55.9% |
[ 0.5% - 1.0% ] 0.64% | 31,999 | 69.3% |
[ 0.5% - 1.0% ] 0.67% | 47,964 | 64.0% |
[ 0.5% - 1.0% ] 0.70% | 116,022 | 58.9% |
[ 0.5% - 1.0% ] 0.72% | 73,852 | 47.2% |
[ 0.5% - 1.0% ] 0.75% | 15,177 | 58.7% |
[ 0.5% - 1.0% ] 0.76% | 104,875 | 53.8% |
[ 0.5% - 1.0% ] 0.79% | 39,791 | 39.8% |
[ 0.5% - 1.0% ] 0.82% | 31,743 | 36.6% |
[ 0.5% - 1.0% ] 0.85% | 18,482 | 72.5% |
[ 0.5% - 1.0% ] 0.87% | 52,558 | 67.9% |
[ 0.5% - 1.0% ] 0.90% | 4,669 | 71.7% |
[ 0.5% - 1.0% ] 0.93% | 64,449 | 66.8% |
[ 0.5% - 1.0% ] 0.95% | 65,148 | 70.0% |
[ 0.5% - 1.0% ] 0.98% | 63,423 | 70.2% |
[ 1.0% - 1.5% ] 1.01% | 51,470 | 39.6% |
[ 1.0% - 1.5% ] 1.03% | 2,997 | 61.8% |
[ 1.0% - 1.5% ] 1.05% | 28,514 | 66.9% |
[ 1.0% - 1.5% ] 1.10% | 10,516 | 86.8% |
[ 1.0% - 1.5% ] 1.12% | 35,378 | 61.5% |
[ 1.0% - 1.5% ] 1.14% | 8,071 | 69.2% |
[ 1.0% - 1.5% ] 1.19% | 26,239 | 43.2% |
[ 1.0% - 1.5% ] 1.20% | 17,308 | 86.3% |
[ 1.0% - 1.5% ] 1.22% | 45,052 | 73.8% |
[ 1.0% - 1.5% ] 1.27% | 4,254 | 58.2% |
[ 1.0% - 1.5% ] 1.30% | 20,325 | 61.1% |
[ 1.0% - 1.5% ] 1.33% | 8,956 | 61.2% |
[ 1.0% - 1.5% ] 1.34% | 1,570 | 68.7% |
[ 1.0% - 1.5% ] 1.37% | 9,324 | 73.0% |
[ 1.0% - 1.5% ] 1.40% | 1,497 | 79.0% |
[ 1.0% - 1.5% ] 1.45% | 4,761 | 71.9% |
[ 1.5% - 2.0% ] 1.53% | 1,308 | 64.8% |
[ 1.5% - 2.0% ] 1.56% | 192 | 64.5% |
[ 1.5% - 2.0% ] 1.57% | 27,083 | 35.7% |
[ 1.5% - 2.0% ] 1.81% | 2,653 | 96.9% |
[ 1.5% - 2.0% ] 1.82% | 2,585 | 55.6% |
[ 1.5% - 2.0% ] 1.87% | 18,567 | 35.7% |
[ 2.0% - 2.5% ] 2.05% | 1,026 | 57.9% |
[ 2.0% - 2.5% ] 2.14% | 468 | 31.3% |
[ 2.0% - 2.5% ] 2.30% | 4,181 | 49.0% |
[ 2.0% - 2.5% ] 2.40% | 208 | 91.4% |
[ 2.5% - 3.0% ] 2.60% | 4,851 | 88.5% |
[ 2.5% - 3.0% ] 2.91% | 9,312 | 84.7% |
[ 4.0% - 4.5% ] 4.36% | 1,146 | 86.1% |
[ 5.0% - 5.5% ] 5.05% | 5,390 | 52.4% |