Immigrants from Sri Lanka Wage/Income Gap
COMPARE
Immigrants from Sri Lanka
Select to Compare
Wage/Income Gap
Immigrants from Sri Lanka Wage/Income Gap
27.1%
WAGE/INCOME GAP
3.7/ 100
METRIC RATING
242nd/ 347
METRIC RANK
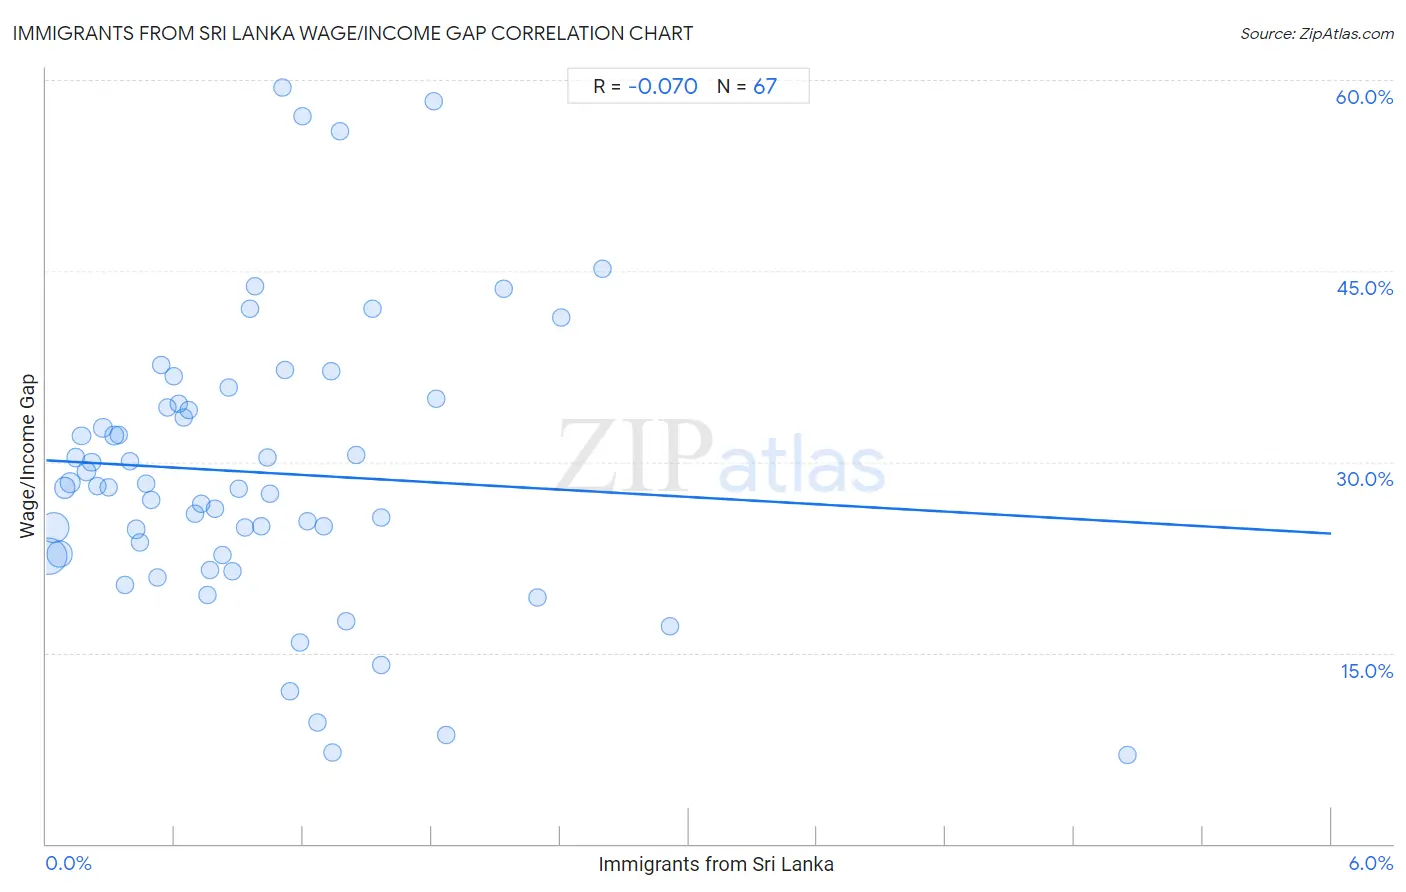
Immigrants from Sri Lanka Wage/Income Gap Correlation Chart
The statistical analysis conducted on geographies consisting of 149,684,649 people shows a slight negative correlation between the proportion of Immigrants from Sri Lanka and wage/income gap percentage in the United States with a correlation coefficient (R) of -0.070 and weighted average of 27.1%. On average, for every 1% (one percent) increase in Immigrants from Sri Lanka within a typical geography, there is a decrease of 0.96% in wage/income gap percentage.
It is essential to understand that the correlation between the percentage of Immigrants from Sri Lanka and wage/income gap percentage does not imply a direct cause-and-effect relationship. It remains uncertain whether the presence of Immigrants from Sri Lanka influences an upward or downward trend in the level of wage/income gap percentage within an area, or if Immigrants from Sri Lanka simply ended up residing in those areas with higher or lower levels of wage/income gap percentage due to other factors.
Demographics Similar to Immigrants from Sri Lanka by Wage/Income Gap
In terms of wage/income gap, the demographic groups most similar to Immigrants from Sri Lanka are Spanish (27.1%, a difference of 0.010%), Creek (27.1%, a difference of 0.050%), Immigrants from Europe (27.1%, a difference of 0.070%), Chickasaw (27.2%, a difference of 0.080%), and Immigrants from the Azores (27.2%, a difference of 0.090%).
| Demographics | Rating | Rank | Wage/Income Gap |
| Immigrants from Hungary | 4.8 /100 | #235 | Tragic 27.0% |
| Immigrants from Romania | 4.8 /100 | #236 | Tragic 27.0% |
| Immigrants from Eastern Asia | 4.4 /100 | #237 | Tragic 27.1% |
| Osage | 4.4 /100 | #238 | Tragic 27.1% |
| Estonians | 4.3 /100 | #239 | Tragic 27.1% |
| Immigrants from Europe | 3.8 /100 | #240 | Tragic 27.1% |
| Creek | 3.8 /100 | #241 | Tragic 27.1% |
| Immigrants from Sri Lanka | 3.7 /100 | #242 | Tragic 27.1% |
| Spanish | 3.6 /100 | #243 | Tragic 27.1% |
| Chickasaw | 3.5 /100 | #244 | Tragic 27.2% |
| Immigrants from the Azores | 3.5 /100 | #245 | Tragic 27.2% |
| Nonimmigrants | 3.3 /100 | #246 | Tragic 27.2% |
| Celtics | 2.8 /100 | #247 | Tragic 27.3% |
| Cypriots | 2.8 /100 | #248 | Tragic 27.3% |
| Carpatho Rusyns | 2.7 /100 | #249 | Tragic 27.3% |
Immigrants from Sri Lanka Wage/Income Gap Correlation Summary
| Measurement | Immigrants from Sri Lanka Data | Wage/Income Gap Data |
| Minimum | 0.013% | 7.0% |
| Maximum | 5.0% | 59.4% |
| Range | 5.0% | 52.4% |
| Mean | 0.99% | 29.2% |
| Median | 0.85% | 28.0% |
| Interquartile 25% (IQ1) | 0.42% | 22.7% |
| Interquartile 75% (IQ3) | 1.3% | 34.6% |
| Interquartile Range (IQR) | 0.91% | 11.8% |
| Standard Deviation (Sample) | 0.82% | 11.3% |
| Standard Deviation (Population) | 0.82% | 11.2% |
Correlation Details
| Immigrants from Sri Lanka Percentile | Sample Size | Wage/Income Gap |
[ 0.0% - 0.5% ] 0.013% | 55,634,119 | 22.6% |
[ 0.0% - 0.5% ] 0.037% | 36,314,504 | 24.8% |
[ 0.0% - 0.5% ] 0.062% | 24,312,188 | 22.7% |
[ 0.0% - 0.5% ] 0.087% | 8,897,531 | 28.0% |
[ 0.0% - 0.5% ] 0.11% | 6,231,687 | 28.4% |
[ 0.0% - 0.5% ] 0.14% | 3,277,377 | 30.3% |
[ 0.0% - 0.5% ] 0.16% | 2,217,035 | 32.0% |
[ 0.0% - 0.5% ] 0.19% | 2,535,301 | 29.3% |
[ 0.0% - 0.5% ] 0.21% | 1,564,987 | 29.9% |
[ 0.0% - 0.5% ] 0.24% | 1,147,156 | 28.1% |
[ 0.0% - 0.5% ] 0.27% | 1,430,343 | 32.7% |
[ 0.0% - 0.5% ] 0.29% | 848,138 | 28.0% |
[ 0.0% - 0.5% ] 0.32% | 748,042 | 32.1% |
[ 0.0% - 0.5% ] 0.34% | 425,560 | 32.1% |
[ 0.0% - 0.5% ] 0.37% | 309,492 | 20.3% |
[ 0.0% - 0.5% ] 0.39% | 282,864 | 30.0% |
[ 0.0% - 0.5% ] 0.42% | 650,090 | 24.7% |
[ 0.0% - 0.5% ] 0.44% | 270,204 | 23.7% |
[ 0.0% - 0.5% ] 0.47% | 503,926 | 28.3% |
[ 0.0% - 0.5% ] 0.49% | 275,868 | 27.0% |
[ 0.5% - 1.0% ] 0.52% | 131,404 | 20.9% |
[ 0.5% - 1.0% ] 0.54% | 170,558 | 37.6% |
[ 0.5% - 1.0% ] 0.57% | 235,928 | 34.3% |
[ 0.5% - 1.0% ] 0.60% | 143,787 | 36.7% |
[ 0.5% - 1.0% ] 0.62% | 48,463 | 34.6% |
[ 0.5% - 1.0% ] 0.64% | 31,999 | 33.5% |
[ 0.5% - 1.0% ] 0.67% | 47,964 | 34.1% |
[ 0.5% - 1.0% ] 0.70% | 116,022 | 25.9% |
[ 0.5% - 1.0% ] 0.72% | 73,852 | 26.7% |
[ 0.5% - 1.0% ] 0.75% | 15,177 | 19.6% |
[ 0.5% - 1.0% ] 0.76% | 104,875 | 21.5% |
[ 0.5% - 1.0% ] 0.79% | 39,791 | 26.3% |
[ 0.5% - 1.0% ] 0.82% | 31,743 | 22.7% |
[ 0.5% - 1.0% ] 0.85% | 18,482 | 35.9% |
[ 0.5% - 1.0% ] 0.87% | 51,982 | 21.4% |
[ 0.5% - 1.0% ] 0.90% | 4,669 | 27.9% |
[ 0.5% - 1.0% ] 0.93% | 64,449 | 24.8% |
[ 0.5% - 1.0% ] 0.95% | 65,148 | 42.0% |
[ 0.5% - 1.0% ] 0.98% | 63,423 | 43.8% |
[ 1.0% - 1.5% ] 1.01% | 51,470 | 24.9% |
[ 1.0% - 1.5% ] 1.03% | 2,997 | 30.3% |
[ 1.0% - 1.5% ] 1.05% | 28,514 | 27.5% |
[ 1.0% - 1.5% ] 1.10% | 10,516 | 59.4% |
[ 1.0% - 1.5% ] 1.12% | 35,378 | 37.3% |
[ 1.0% - 1.5% ] 1.14% | 8,071 | 12.0% |
[ 1.0% - 1.5% ] 1.19% | 26,239 | 15.8% |
[ 1.0% - 1.5% ] 1.20% | 17,308 | 57.1% |
[ 1.0% - 1.5% ] 1.22% | 45,052 | 25.4% |
[ 1.0% - 1.5% ] 1.27% | 4,254 | 9.5% |
[ 1.0% - 1.5% ] 1.30% | 16,664 | 24.9% |
[ 1.0% - 1.5% ] 1.33% | 8,956 | 37.1% |
[ 1.0% - 1.5% ] 1.34% | 1,570 | 7.1% |
[ 1.0% - 1.5% ] 1.37% | 9,324 | 56.0% |
[ 1.0% - 1.5% ] 1.40% | 1,497 | 17.5% |
[ 1.0% - 1.5% ] 1.45% | 4,761 | 30.5% |
[ 1.5% - 2.0% ] 1.52% | 460 | 42.1% |
[ 1.5% - 2.0% ] 1.56% | 192 | 25.6% |
[ 1.5% - 2.0% ] 1.57% | 27,083 | 14.1% |
[ 1.5% - 2.0% ] 1.81% | 2,653 | 58.3% |
[ 1.5% - 2.0% ] 1.82% | 2,585 | 35.0% |
[ 1.5% - 2.0% ] 1.87% | 18,567 | 8.5% |
[ 2.0% - 2.5% ] 2.14% | 468 | 43.6% |
[ 2.0% - 2.5% ] 2.30% | 4,181 | 19.4% |
[ 2.0% - 2.5% ] 2.40% | 208 | 41.4% |
[ 2.5% - 3.0% ] 2.60% | 4,851 | 45.2% |
[ 2.5% - 3.0% ] 2.91% | 9,312 | 17.1% |
[ 5.0% - 5.5% ] 5.05% | 5,390 | 7.0% |